While earnings season is always unpredictable, the options market could be signaling for a massive move for Unity Software (U). A video game software development company, U stock has been one of the top performers in the trailing 52 weeks, having almost doubled in value. Recently, management announced that it will release its fourth-quarter results on Feb. 11, before the opening bell.
For those who enjoy speculation, Unity Software stock needs to be on your radar.
Primarily, the smart money seems unusually enthusiastic about the gaming specialist. Specifically, options flow — which focuses exclusively on big block transactions likely placed by institutional investors — has seen net trade sentiment shift decisively in the positive direction since the Jan. 7 session. What was particularly noteworthy was activity on Jan. 12, which saw net flows jump to over $2 million in favor of the bulls.
Even more enticing, on that day, nearly 46% of these net flows were directed toward $50 calls expiring March 20. From the available evidence, this transaction appears to be debit based, meaning that on an intrinsic level, U stock would need to rise $4.60 above the strike to break even. That would imply more than a 24% swing from the current spot price, which is quite an ambitious target.
Another factor to consider is the Expected Move calculator. Using a variant of the Black-Scholes model and integrated with the appropriate implied volatility (IV) data, U stock would be anticipated to land between $36.71 and $51.25 (a spread of 16.52%) on the Feb. 20 expiration date.
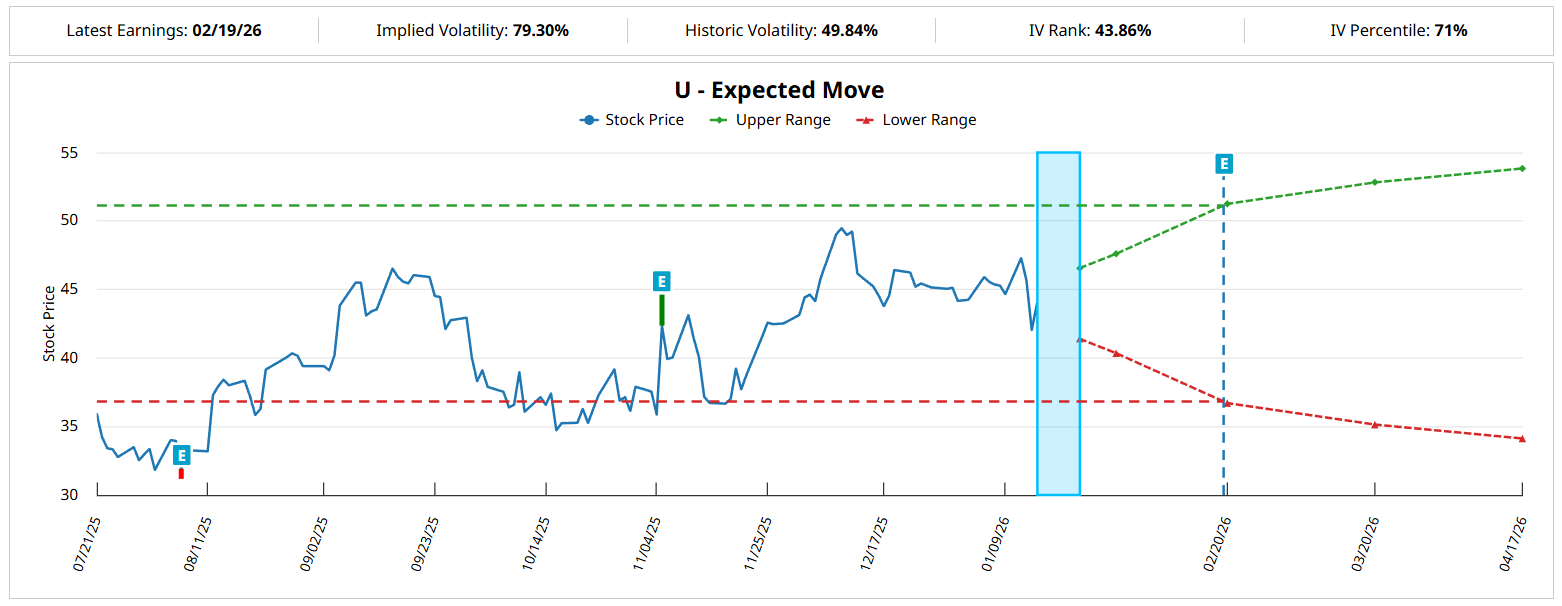
Rather than an opinion-based forecast, IV is a residual statistic that stems from actual order flows. So, while we don’t know where in the projected dispersion Unity stock is likely to land, the dispersion itself is an empirical construct of actual sentiment. It provides an important first clue regarding trajectory — and we can add another layer to grab even more insights.
Using the Markov Property to Calculate the Risk Model of U Stock
A Wall Street pricing standard, Black-Scholes is best understood as a first-order analysis. This model captures the baseline structure of security’s option pricing under the simplest possible dynamics. In other words, it’s a clean, universal reference point that is not encumbered with potentially distortive elements such as feedback loops, regime shifts and behavioral state evolutions.
Again, it’s a clean canvas that is applied to every optionable security, whether that business covers semiconductors or cactus water. However, because of its universality, Black-Scholes is almost surely not reflecting the nuances of individual securities, especially highly kinetic ones like U stock.
Imagine a game of football. Black-Scholes is like the standard 4-3 defensive formation. However, if the offense lines up in an obvious passing formation, the defense will probably want to shift to a dime package to protect against the deep ball. This shift would occur because the context of the game has changed.
Similarly, we can adopt a second-order analytical approach called the Markov property. Colloquially, the Markov property asserts that what happens tomorrow is largely dependent on what happens today. In other words, past market behaviors will likely influence the forward pathway of the target security.
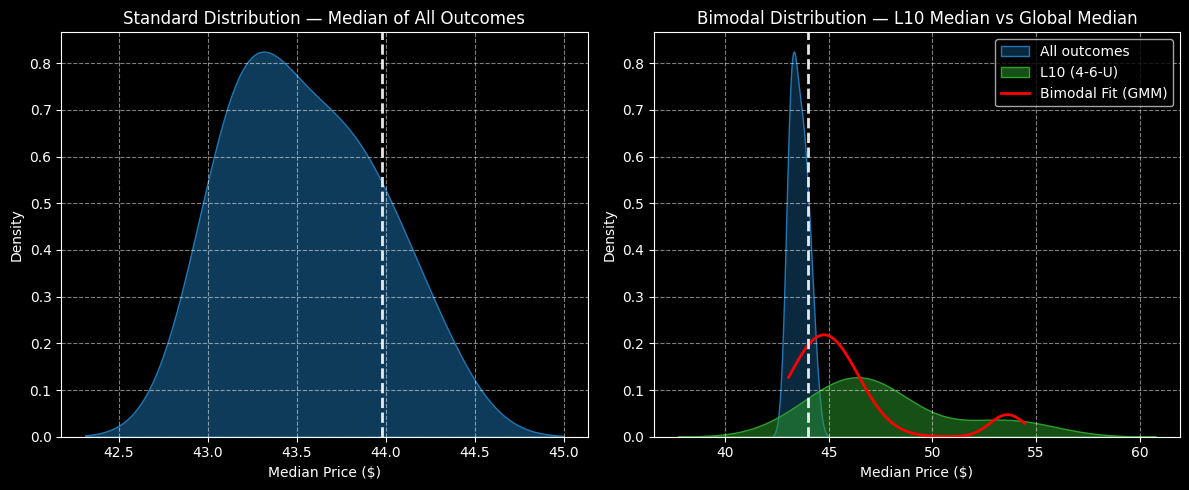
Ordinarily, you would expect a 10-week long position in U stock to land between $42 and $45, assuming a spot price of $43.98 (Thursday’s close). Further, probability density would likely peak at around $43.30, implying a generally negative bias.
However, in the past 10 weeks, U stock had only printed four up weeks, but with an overall upward slope. This unusual 4-6-U sequence tends to influence the next 10 weeks, such that forward outcomes would be expected to land between $38 and $60. Probability density would likely peak at around $47, thus implying an upward bias.
Interestingly, even looking at the five-week fixed-time distribution, probability density would likely peak between $47 and $47.50, suggesting robust near-term momentum. Combined with the positive options flow data, the smart money could be gunning for a big move in U stock.
Swinging for the Fences
Those who are extremely risk tolerant and seeking a big payout may consider the 48/50 bull call spread expiring Feb. 20. This wager involves two simultaneous transactions: buy the $48 call and sell the $50 call, for a net debit paid of $74 (the most that can be lost).
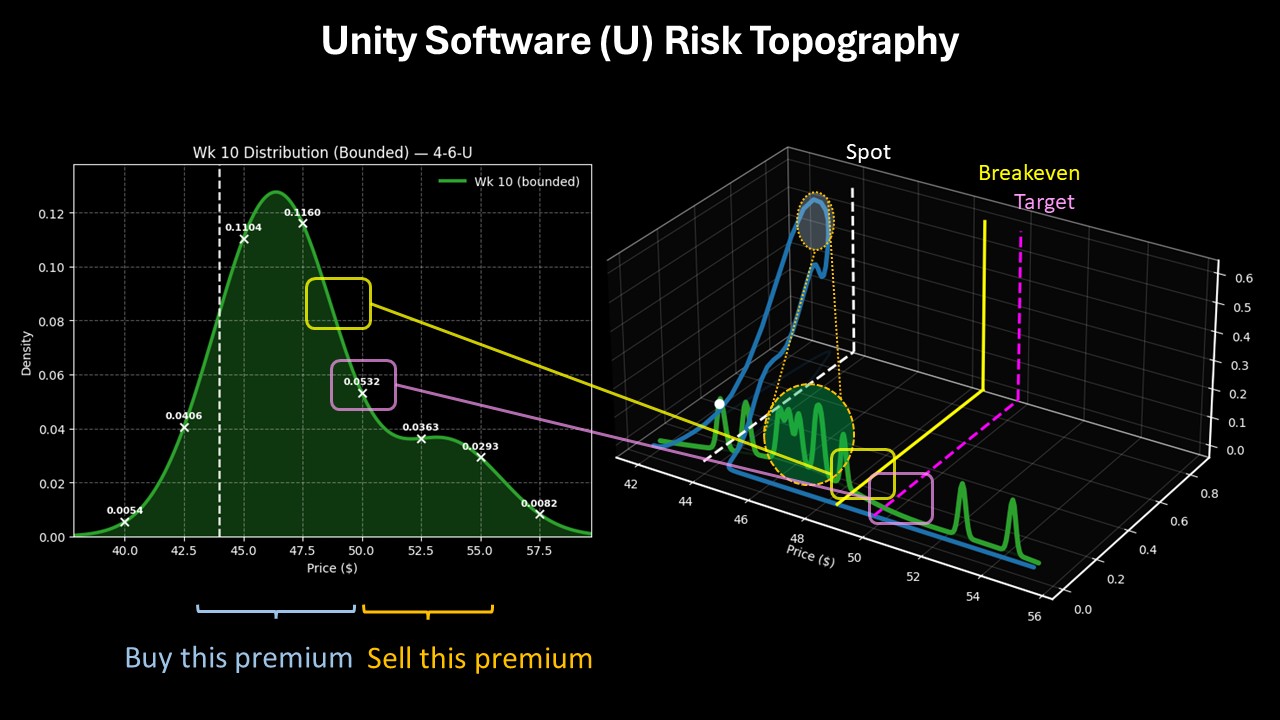
Should U stock rise through the $50 strike at expiration, the maximum profit would come out to $126, a payout of over 170%. Breakeven lands at $48.74, which is reasonably near peak density under 4-6-U conditions.
Looking at risk topography — a three-dimensional view of demand structure — trial frequency is concentrated between $44 and $48. This dynamic places the breakeven price near the concentration of activity, which gives it a higher likelihood of breaking even. However, the second leg of the trade stretches so that it can attempt to grab the upper price realms without incurring an opportunity cost.
Finally, the first-order Black-Scholes-based Expected Move calculator does suggest that a $50 target is within the realm of rationality. Even better, the second-order Markov property forecasts that a bullish response is more likely than a bearish one. As such, I’m really excited about Unity Software stock.
On the date of publication, Josh Enomoto did not have (either directly or indirectly) positions in any of the securities mentioned in this article. All information and data in this article is solely for informational purposes. For more information please view the Barchart Disclosure Policy here.
More news from Barchart