Exelon Corporation (EXC), headquartered in Chicago, Illinois, stands as one of the nation's largest utility companies, serving millions of customers across six regulated utilities. These include Atlantic City Electric, BGE, ComEd, Delmarva Power, PECO, and Pepco. Focused on transmission and distribution, Exelon delivers reliable, clean, and affordable energy. The company has a market capitalization of $45.19 billion.
Exelon is set to report its fourth-quarter results on Feb. 12, before the market opens. Ahead of the results, Wall Street analysts have a mixed view of the company’s bottom-line growth trajectory.
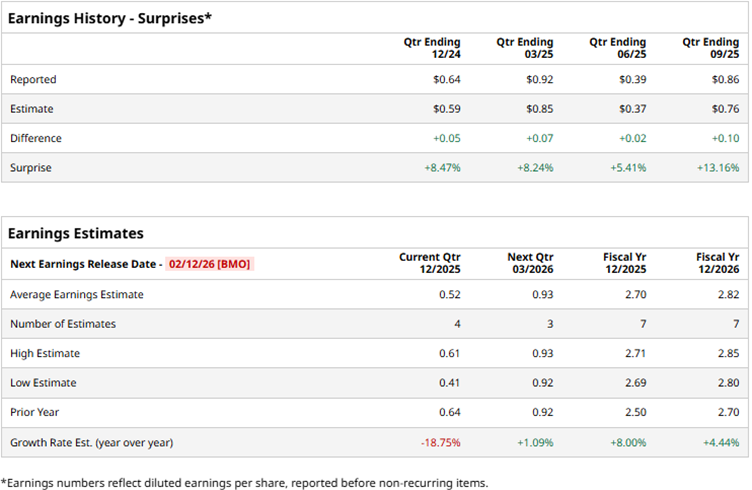
For the fourth quarter, they expect its profit to decline 18.8% year-over-year (YOY) to $0.52 per diluted share. On the other hand, for the fiscal year 2025, its profit is expected to grow by 8% annually to $2.70 per diluted share, followed by a 4.4% improvement to $2.82 in fiscal 2026. The company has a solid history of surpassing consensus estimates, topping them in each of the trailing four quarters.
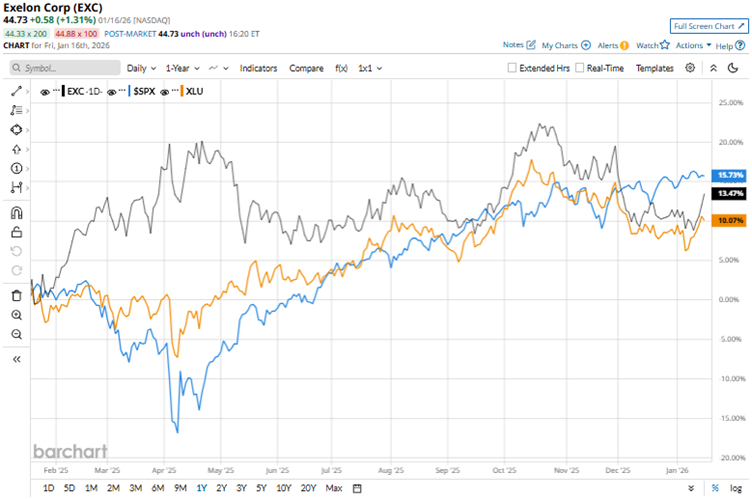
Over the past 52 weeks, the stock has gained 13.7%, while it is up by 4.4% over the past six months. Comparing this to the broader S&P 500 Index ($SPX), which has gained 16.9% and 10.8% over the same periods, respectively, we see a clear underperformance. Now, we compare its performance with that of its sector. The State Street Utilities Select Sector SPDR ETF (XLU) has increased by 10.2% over the past 52 weeks and 5.8% over the past six months. So, while the stock has outperformed its sector over the past year, it has underperformed over the past six months.
On Nov. 4, Exelon reported solid third-quarter results. The company’s operating earnings increased by 9% YOY to $6.71 billion, surpassing the $6.35 billion that Street analysts had expected. Its adjusted operating EPS for the quarter was $0.86, up 21.1% YOY and exceeding the $0.76 estimate, reflecting higher utility earnings driven by a range of factors, including distribution and transmission rates at ComEd and PHI. Exelon expects to meet its full-year EPS guidance of $2.64 to $2.74. However, the stock only gained marginally on Nov. 4.
Wall Street analysts have been soundly bullish about Exelon’s future. Among the 20 analysts covering the stock, the consensus rating is “Moderate Buy.” The ratings configuration is more bullish than it was three months ago, with eight “Strong Buy” ratings now, up from seven. The ratings are rounded by 10 “Holds” and two “Strong Sells.”
The mean price target of $49.35 indicates a 10.3% upside from current levels, while the Street-high price target of $57 implies a 27.4% upside.
On the date of publication, Anushka Dutta did not have (either directly or indirectly) positions in any of the securities mentioned in this article. All information and data in this article is solely for informational purposes. For more information please view the Barchart Disclosure Policy here.
More news from Barchart
- After Rigetti Announced a Quantum Computing Delay, How Should You Play RGTI Stock in January 2026?
- Wells Fargo Says You Should Buy the Dip in Broadcom Stock
- Taiwan Semi Crushed Q4 Earnings. That Makes This 1 AI Chip Stock a Top Buy.
- As Trump Hits AMD MI325X Chips with a 25% Tariff, How Should You Play AMD Stock?