- FTAI Aviation (FTAI) has surged 242% over the past year, recently hitting a new all-time high.
- FTAI exhibits strong technical momentum and maintains a 100% “Buy” opinion from Barchart.
- Revenue and earnings are both projected to grow sizably this year and next.
- Most analysts rate FTAI a “Strong Buy” although some warn of overvaluation.
Today’s Featured Stock
Valued at $28.75 billion, FTAI Aviation (FTAI) owns and maintains commercial jet engines with a focus on CFM56 engines.
What I’m Watching
I found today’s Chart of the Day by using Barchart’s powerful screening functions to sort for stocks with the highest technical buy signals; superior current momentum in both strength and direction; and a Trend Seeker “buy” signal. I then used Barchart’s Flipcharts feature to review the charts for consistent price appreciation. FTAI checks those boxes. Since the Trend Seeker signaled a new “Buy” on Dec. 30, the stock has gained 45.18%.
Barchart Technical Indicators for FTAI Aviation
Editor’s Note: The technical indicators below are updated live during the session every 20 minutes and can therefore change each day as the market fluctuates. The indicator numbers shown below therefore may not match what you see live on the Barchart.com website when you read this report. These technical indicators form the Barchart Opinion on a particular stock.
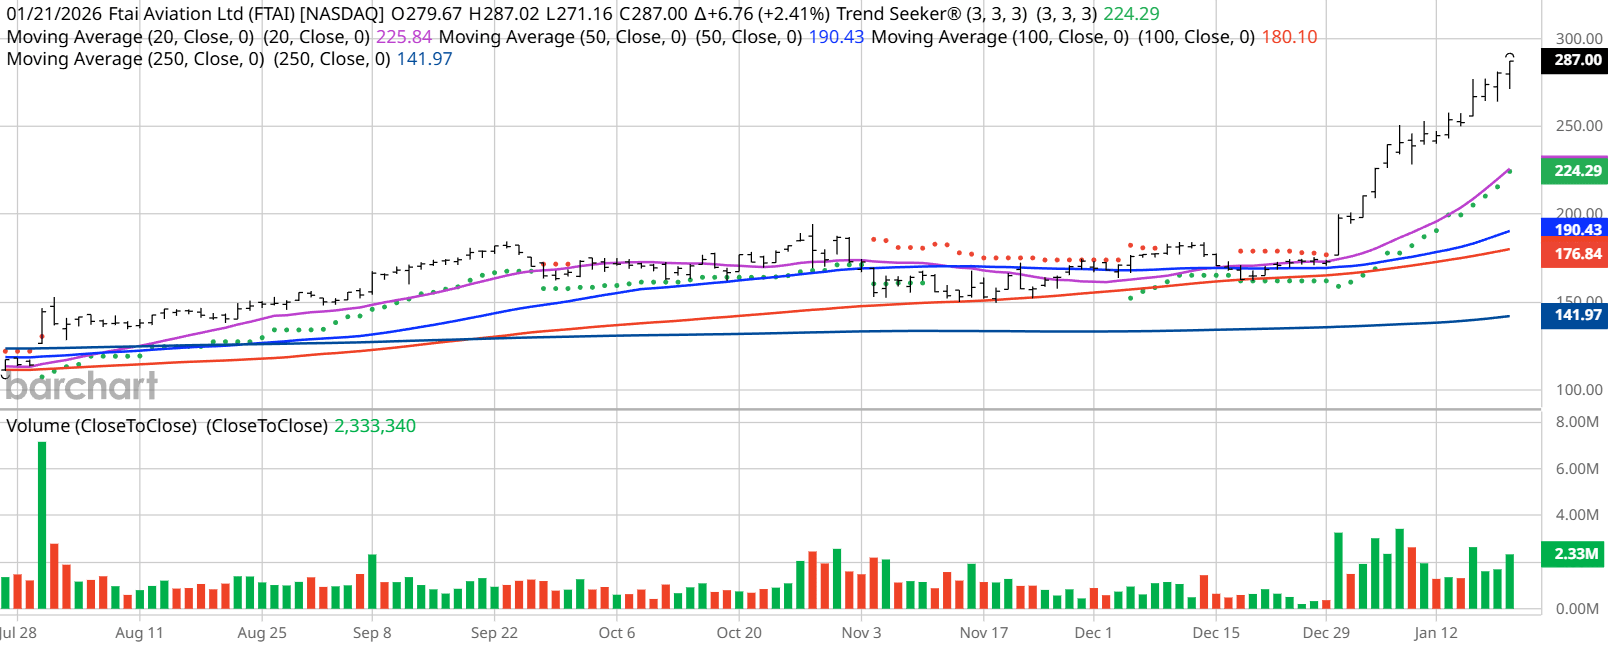
FTAI scored a new all-time high of $287.02 on Jan. 21.
- FTAI has a Weighted Alpha of +260.71.
- The stock has a 100% “Buy” opinion from Barchart.
- The stock gained 242.52% over the past year.
- FTAI has its Trend Seeker “Buy” signal intact.
- The stock recently traded at $287 with a 50-day moving average of $190.43.
- FTAI made 16 new highs and gained 70.34% in the last month.
- Relative Strength Index (RSI) is at 88.92.
- There’s a technical support level around $276.43.
Don’t Forget the Fundamentals
- $28.75 billion market capitalization.
- 62.49x trailing price-earnings ratio.
- 0.49% dividend yield.
- Revenue is projected to increase 47.18% this year and another 25.18% next year.
- Earnings are estimated to increase 162.95% this year and an additional 41.08% next year.
Analyst and Investor Sentiment on FTAI Aviation
- Wall Street analysts tracked by Barchart gave 9 “Strong Buy,” 1 “Moderate Buy” and 1 “Hold” opinion on the stock with price targets between $205 and $327.
- Value Line ranks the stock “Average” with price targets between $171 and $434.
- CFRA’s MarketScope Advisor rates the stock a “Strong Sell.”
- Morningstar thinks with the stock’s recent runup, it’s 13% overvalued.
- 61 investors following the stock on Motley Fool predict the stock will beat the market while 15 think it won’t.
- 7,840 investors are monitoring the stock on Seeking Alpha, which rate the stock a “Hold.”
- Short interest is a reasonable 3.34% of the float.
The Bottom Line on FTAI Aviation
I just came back from an international trip and the airports were packed. Every flight we took was full. Major airlines depend on this company to keep them in the air, plus Wall Street analysts are making great revenue and earnings projections.
Additional disclosure: The Barchart Chart of the Day highlights stocks that are experiencing exceptional current price appreciation. They are not intended to be buy recommendations as these stocks are extremely volatile and speculative. Should you decide to add one of these stocks to your investment portfolio it is highly suggested you follow a predetermined diversification and moving stop loss discipline that is consistent with your personal investment risk tolerance.
On the date of publication, Jim Van Meerten did not have (either directly or indirectly) positions in any of the securities mentioned in this article. All information and data in this article is solely for informational purposes. For more information please view the Barchart Disclosure Policy here.
More news from Barchart
- KHC Is Low-Hanging Fruit for Greg Abel: Which Warren Buffett Stock Will He Sell Next?
- The ‘Trump Effect’ Makes Intel’s Earnings Report Tonight Very Special. Why You Should Brace for a Double-Digit Move in INTC Stock.
- As SoFi Stock Drops Below $30, Is it a Buy Ahead of Q4 Earnings?
- AMD Stock Outperformed Nvidia. Is It Still a Buy?