While it’s tempting to search for narrative insights that the market may have missed, chances are, whatever major drivers that can materially impact a publicly traded company’s valuation has probably already been priced in. As such, the more effective means of assessing the forward dynamics of a security may be to frame the market behaviors using the Markov property.
Under Markov, the future state of a system depends solely on the current state. Colloquially, this simply means that probabilities are influenced by context. For example, in professional football, a 20-yard field goal is practically considered a guaranteed three points. However, if you throw in the context of snow, crosswinds and playoff pressure, suddenly, the calculus changes quite dramatically.
Over the last several months, I have exclusively analyzed securities based on an inductive model underpinned by Markovian logic. Essentially, the idea is that a security never enters the frame under a strictly neutral state. Instead, it enters under a particular context and, based on this setup, certain outcomes are more likely to materialize than others.
If a stock was previously sold off heavily in prior sessions, this context will almost surely have a different impact moving forward than if the same stock had previously enjoyed an extended series of upswings. For lack of a better phrase, stocks have a “memory” of the immediate past — and that memory can then influence future behaviors.
Of course, the philosophical criticism of induction is that there’s no evidence that repeated trials of particular events are guaranteed to materialize the same way in the future. That’s especially the risk with the market, where exogenous factors can easily disrupt the most well-reasoned analysis.
Still, the operational point is that humans are creatures of habit. As such, the belief is that repeated trials may create behavioral gravity wells that we may potentially profit from.
Bull Spread Idea: Salesforce (CRM)
Salesforce (CRM) may be off to a rocky start this year but the red ink just might entice a contrarian position. Since the beginning of January, CRM stock is down nearly 14%. Over the past 52 weeks, the security slipped about 32%. Unsurprisingly, the Barchart Technical Opinion indicator rates shares as a 56% Sell, pointing to a weakening short-term outlook.
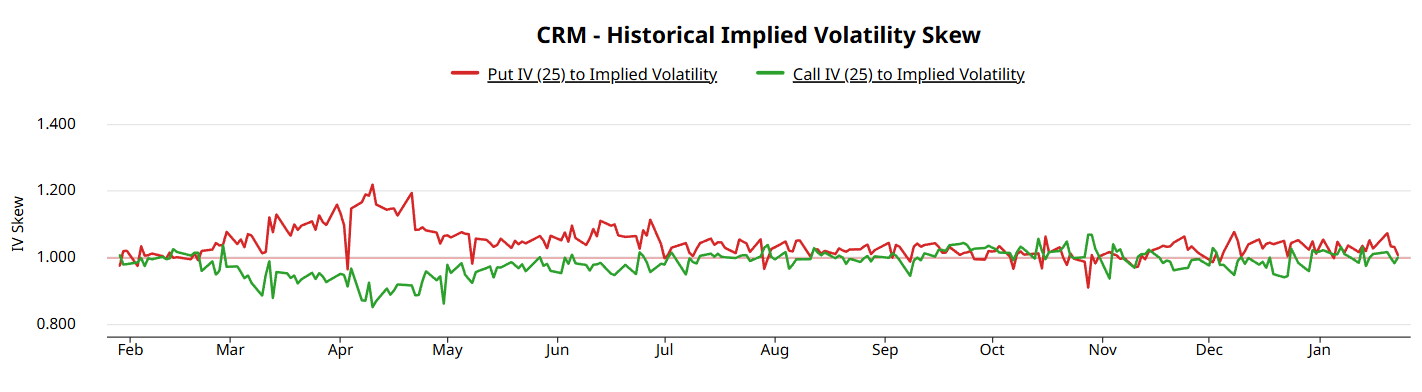
What’s interesting about CRM stock is the volatility skew. Right now, traders are prioritizing downside protection based on the activity of puts across both multiple expiration dates and strike prices. That’s not to say that they aren’t looking for upside. However, the way that the derivatives market is structured suggests an anticipation of a higher probability of downside.
Nevertheless, context may be everything. In the last 10 weeks, CRM stock printed six up weeks but with an overall downward slope. Under this rare 6-4-D sequence, CRM would be expected to range between $210 and $250 over the next 10 weeks, with probability density peaking around $235 (assuming a spot price of $228.05). Over the next five weeks, probability density would likely peak between $223 and $237.
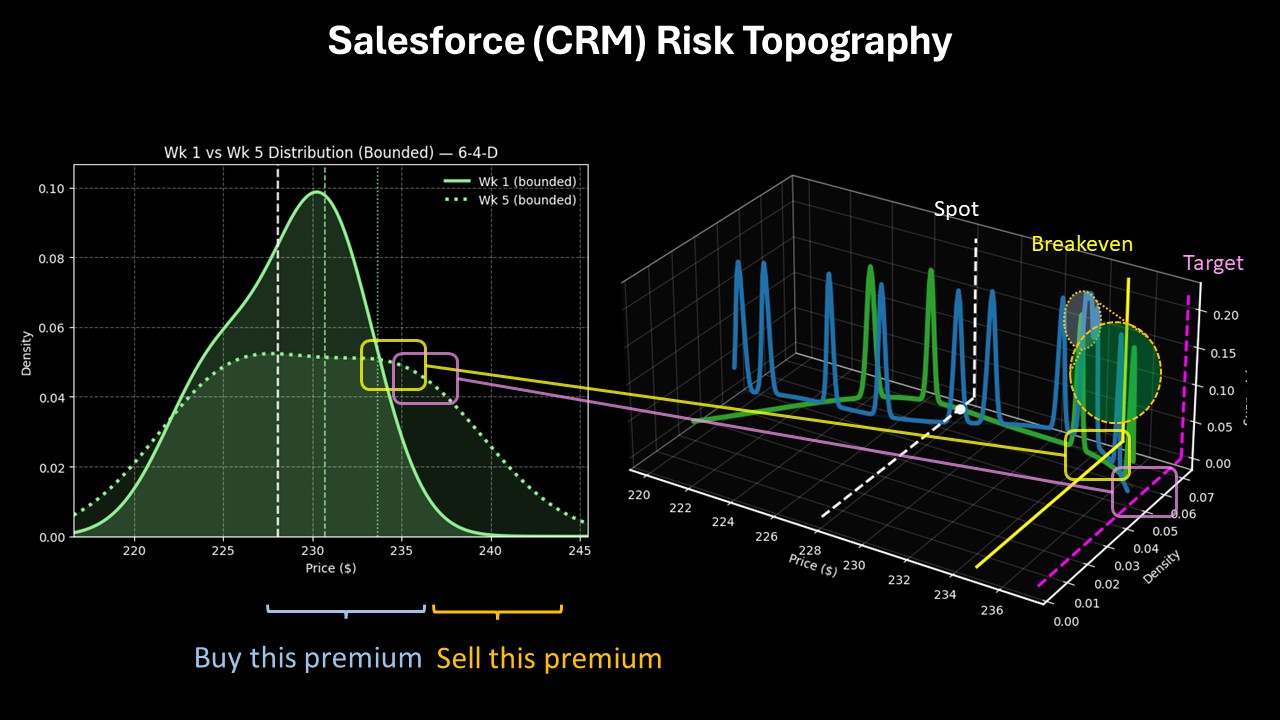
For intrepid speculators, the 232.50/237.50 bull call spread expiring Feb. 20 could be intriguing, especially since the breakeven price lands at a reasonable $234.90. Should CRM stock rise through the $237.50 strike at expiration, the maximum payout would stand at over 108%.
Bear Spread Idea: Mosaic (MOS)
Mosaic (MOS) may have a 24% Weak Sell rating from the Barchart Technical Opinion indicator but it’s currently one of the strongest names in the market. On Friday, MOS stock gained over 2%, bringing its year-to-date tally to a remarkable 19.51%. Despite the strong technical performance, the fundamental picture is suspect, with the company reporting weaker-than-expected demand.
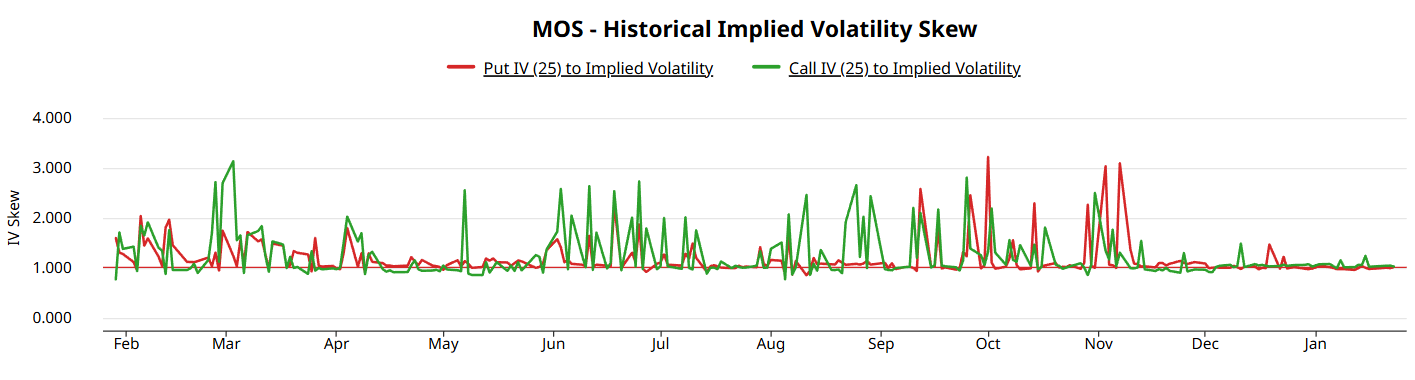
Volatility skew shows pensiveness, with implied volatility (IV) on calls rising higher than puts on strike prices below the current spot price. In addition, put IV tends to swing higher on strikes above spot. Overall, this posture suggests that traders are prioritizing downside insurance. Further, the perception is that the negative movements have a higher likelihood of materializing.
In this case, I believe this perception aligns with reality. Over the last 10 weeks, MOS stock had printed seven up weeks, leading to an overall upward slope. Under this 7-3-U sequence, the forward 10 weeks would be expected to range between $24 and $31 (assuming a spot price of $28.79, Friday’s close).
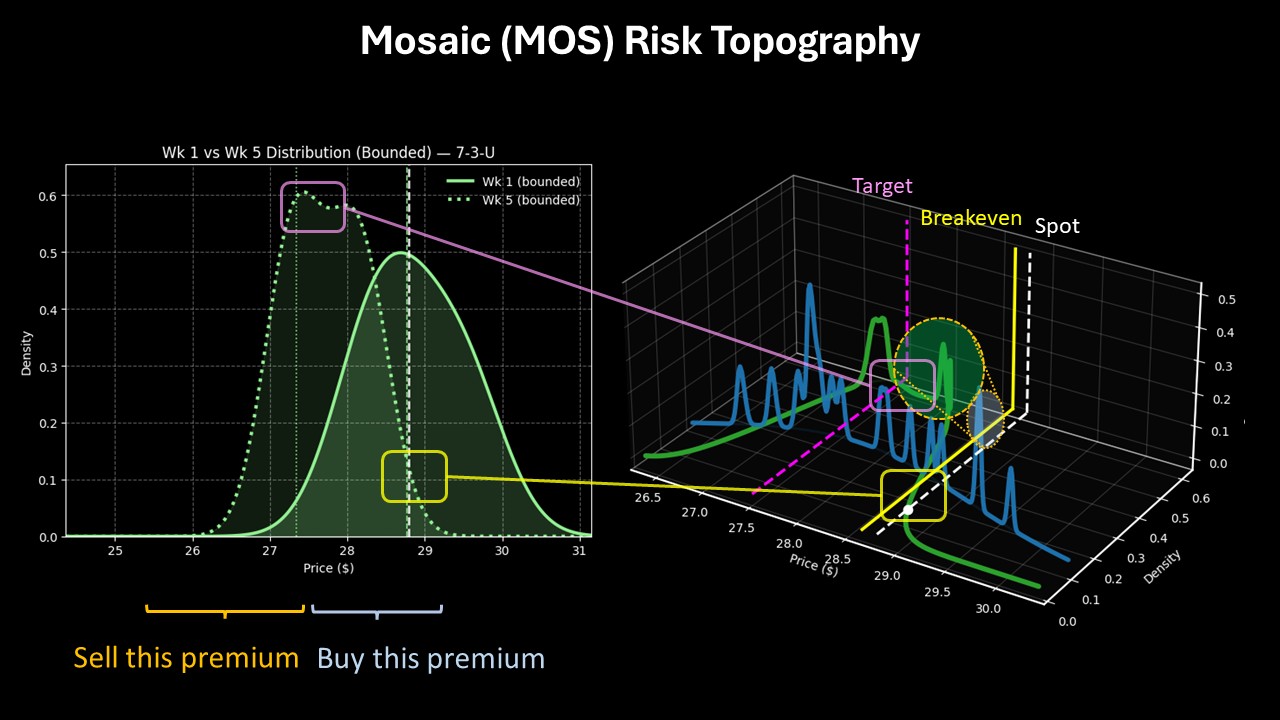
Over the next five weeks, forward outcomes would likely congregate between $26 and $29.50, with probability density peaking around $27. Given how the probabilities are stacking up, traders may find temporary success going with the 30/27.50 bear put spread expiring Feb. 20. Should MOS stock fall through the $27.50 strike, the maximum payout would be nearly 84%.
On the date of publication, Josh Enomoto did not have (either directly or indirectly) positions in any of the securities mentioned in this article. All information and data in this article is solely for informational purposes. For more information please view the Barchart Disclosure Policy here.
More news from Barchart
- The Saturday Spread: Using Inductive Reasoning to Identify Options Trading Opportunities
- Unusual Options Activity Just Flashed on 3 Stocks: 2 Bull Calls, 1 Bull Put Income Play
- Tesla Inc Put Options Still Look Attractive to Short-Sellers Before Earnings Next Week
- Find Out How Covered Call Option Traders Can Use RSI and Bollinger Bands to Gain an Edge