Check out this chart of cocoa ($SG2D) over the past 3 years. Bittersweet, isn’t it? Literally, as in bitter and then sweet, if you’re a consumer of chocolate products like I am (72% cocoa or higher, please).
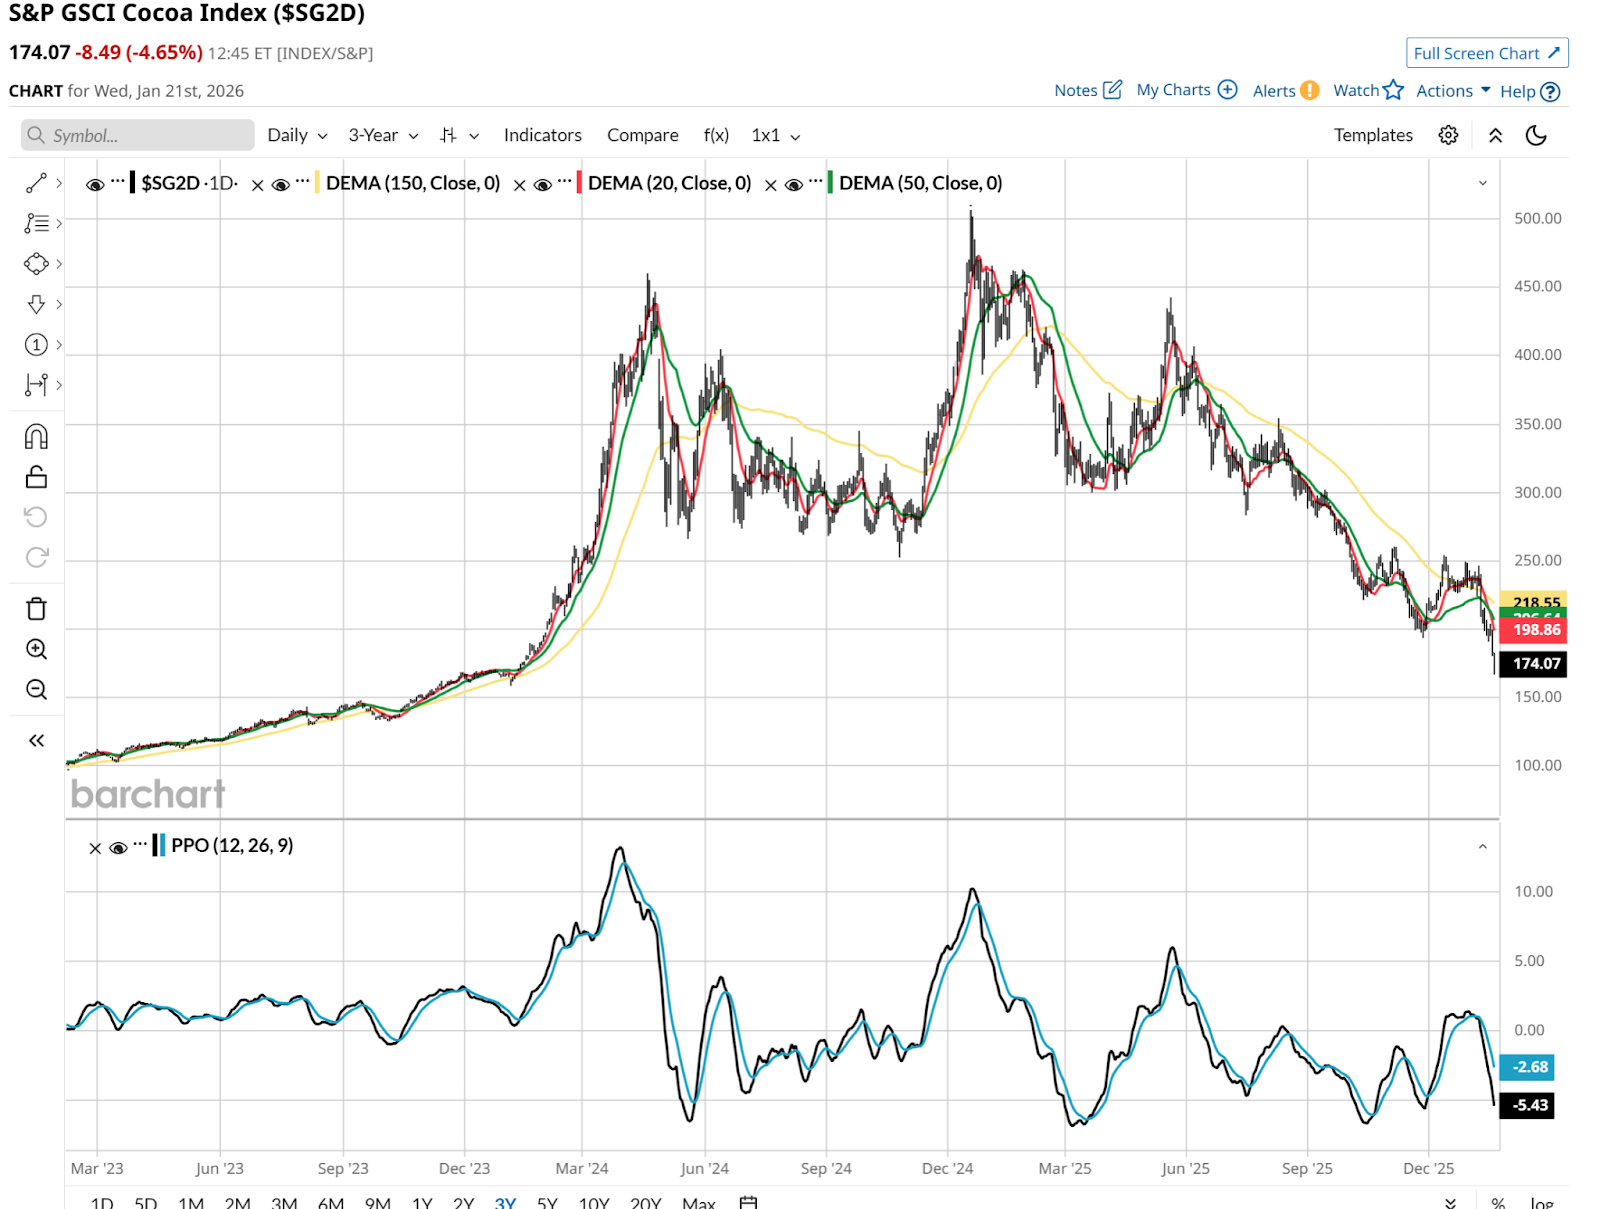
After all, the main commodities used to mass-produce chocolate are cocoa (CCH26) and sugar (SBH26). The former spiked upwards in price during 2023 and, after a brief pullback, again during most of 2024 and early 2025. Then, it dropped just as quickly as it rose.
Hershey Foods (HSY) is a company that has been all about chocolate since Milton Hershey founded his iconic, eponymous company in 1894. Thus, the price of its main input, cocoa, is highly correlated to cost, revenue, and profits.
Here, we can see the daily price chart of HSY stock over that same 3-year time frame. No Mr. Goodbar here. Tariffs didn’t help either, given that so much cocoa originates outside of the United States.
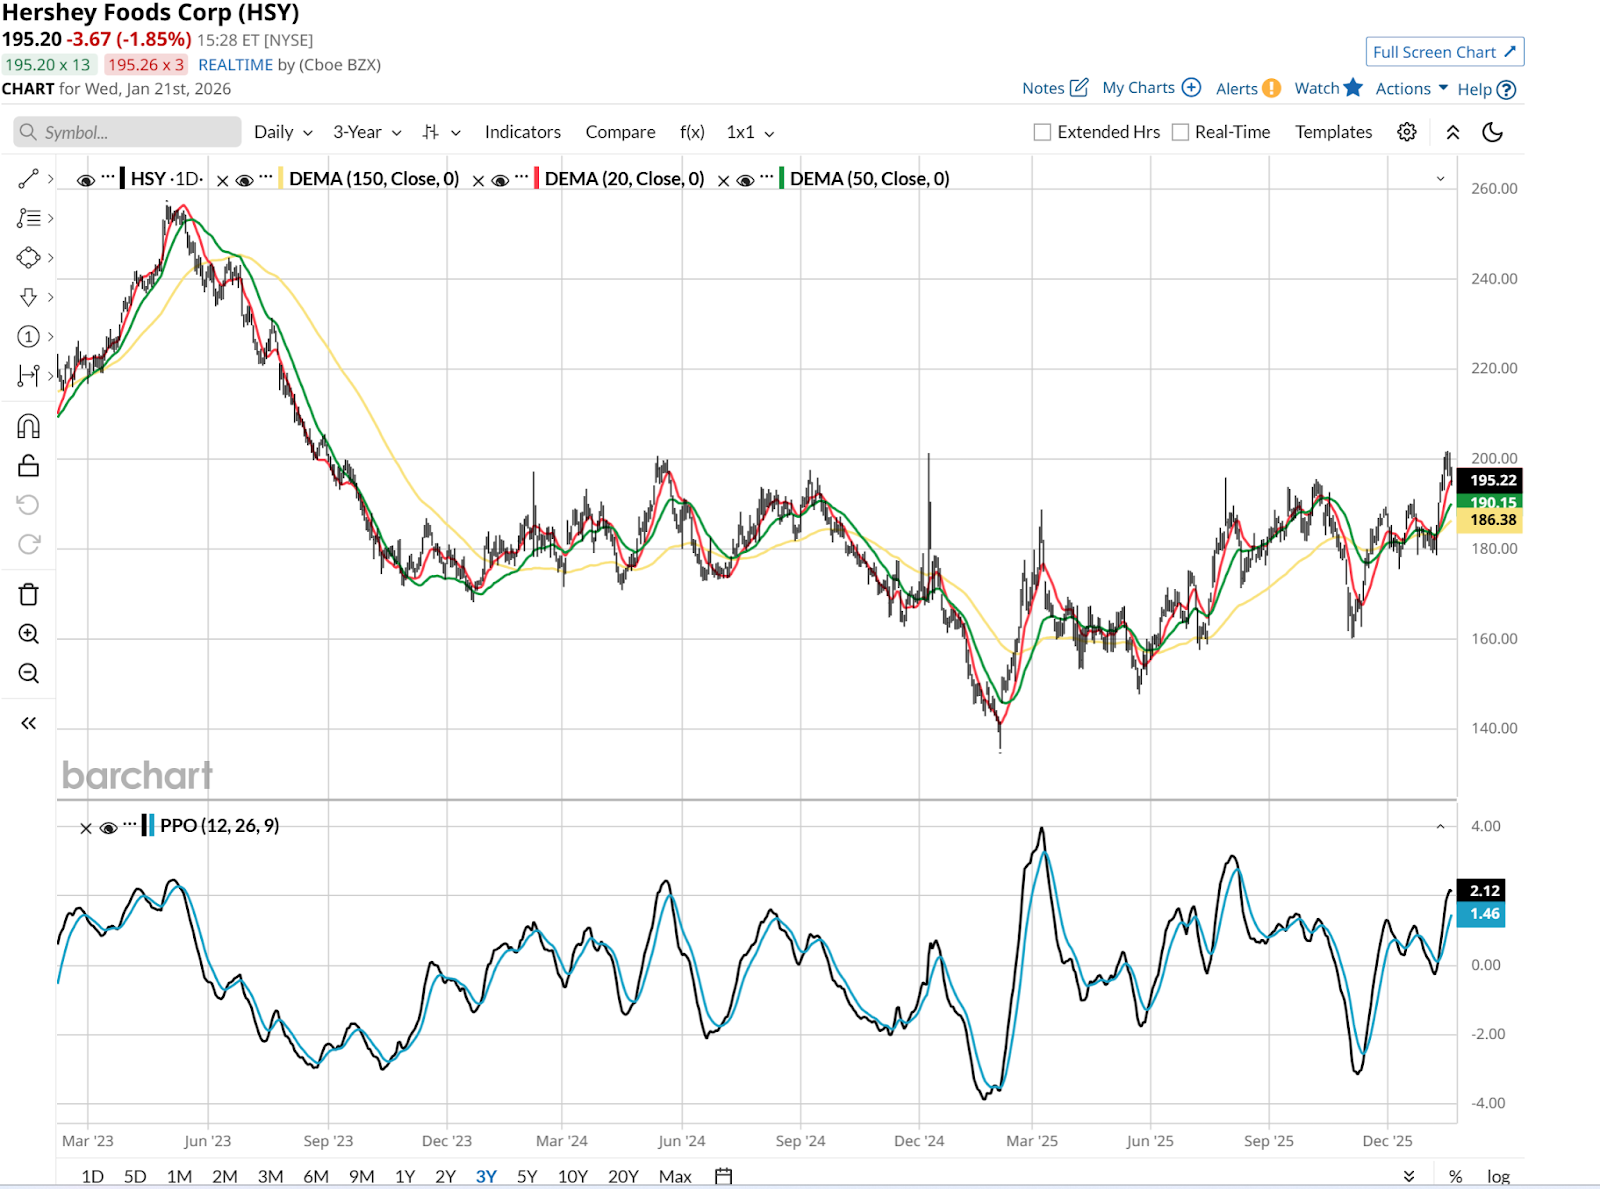
Those historically high commodity prices and import duties took more than 7% off gross margins as of mid-2025. But as we enter 2026, the narrative is flipping from inflation nightmare to deflation tailwind. Much to the delight of sweet-toothers everywhere.
HSY should be able to benefit from what is known as price retention. Hershey aggressively hiked prices by up to 20% to offset the cocoa spike. Now that cocoa futures are retreating from their record highs, Hershey isn’t lowering those prices. This creates a massive margin “pop” as cheaper raw materials meet higher retail prices.
There’s also the factor referred to as affordable luxury. Even with higher prices, candy remains a resilient guilty pleasure. The American consumer isn’t giving up chocolate even under price pressure.
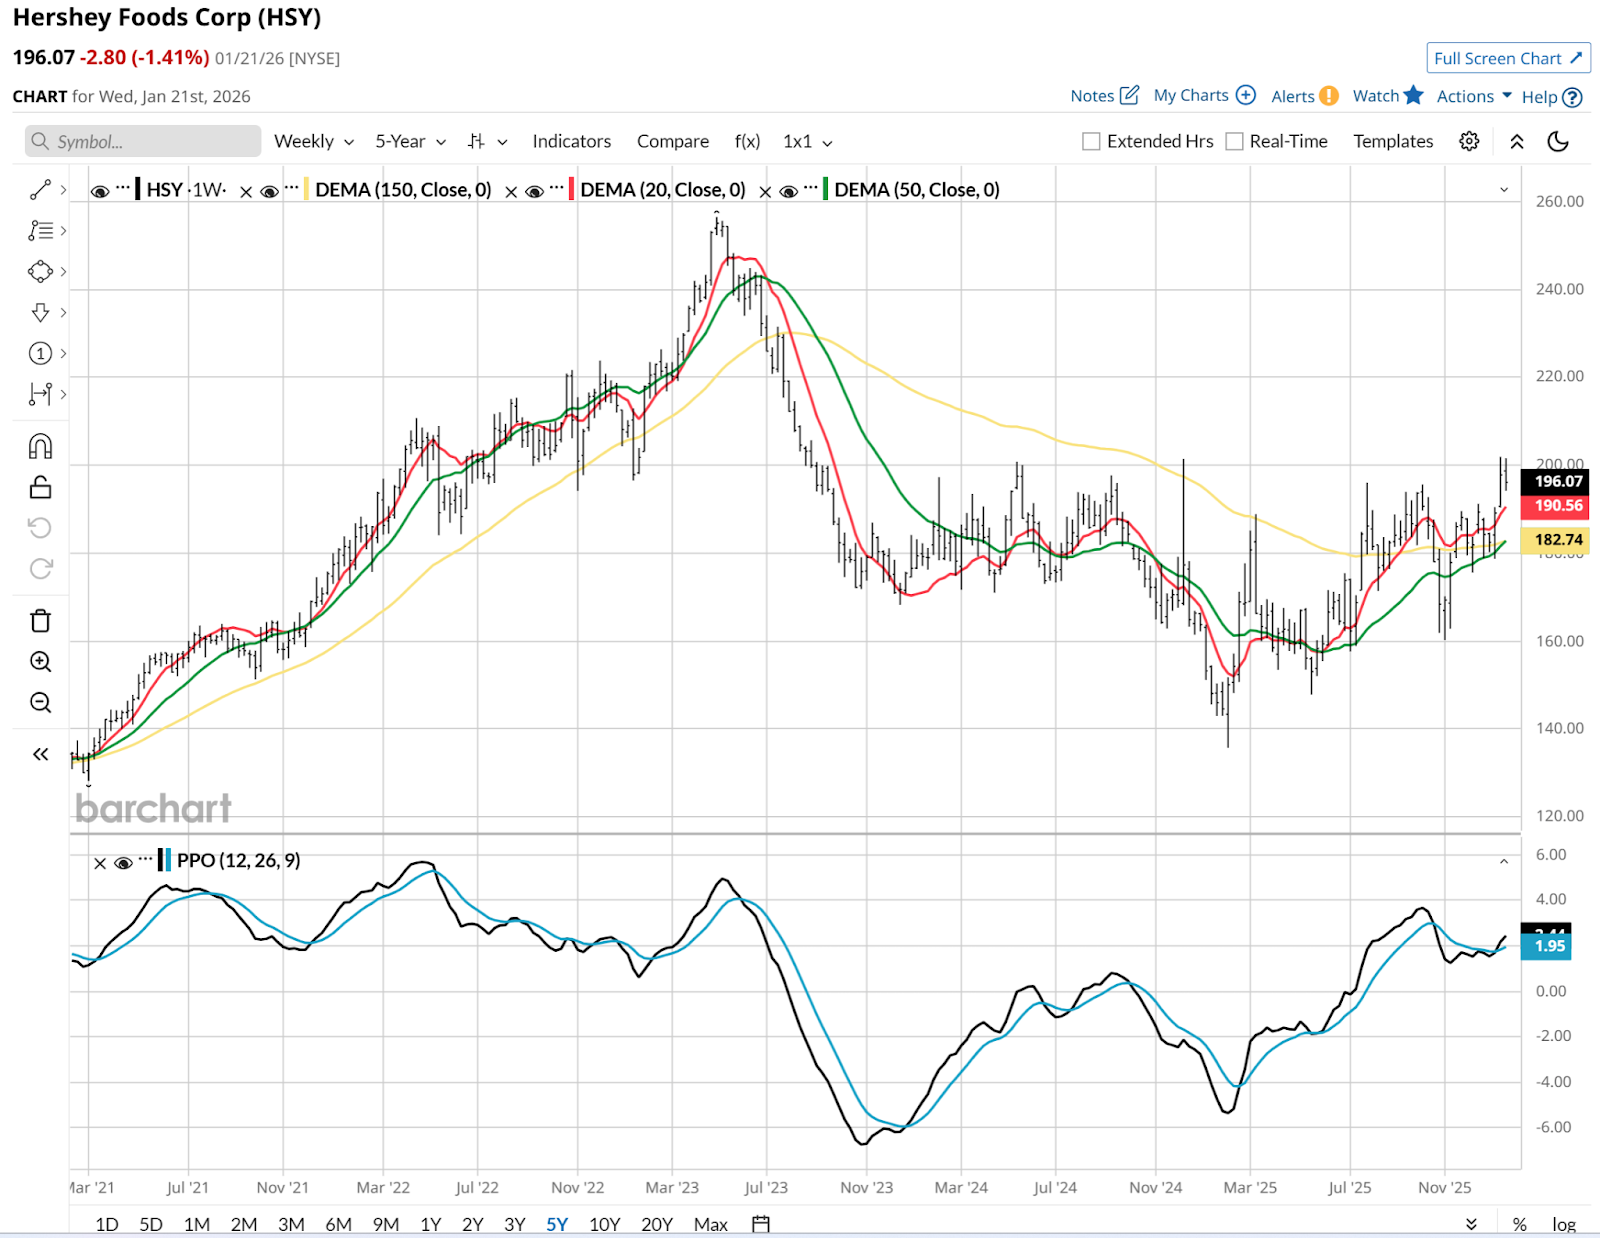
Sugar-High Breakout
This weekly chart is what makes me think there could be an intermediate-term upside. The $200 price area is close to being broken to the upside. It has been nearly three years since the last decisive move through that level. If it can push through soon, then the all-time high of $260 is 30% north of here. That’s a good target if the broader market cooperates.
Earnings are Feb. 5, and it appears analysts are neutral on the stock. It has a “Hold” rating across 22 firms. As it has for a few months.
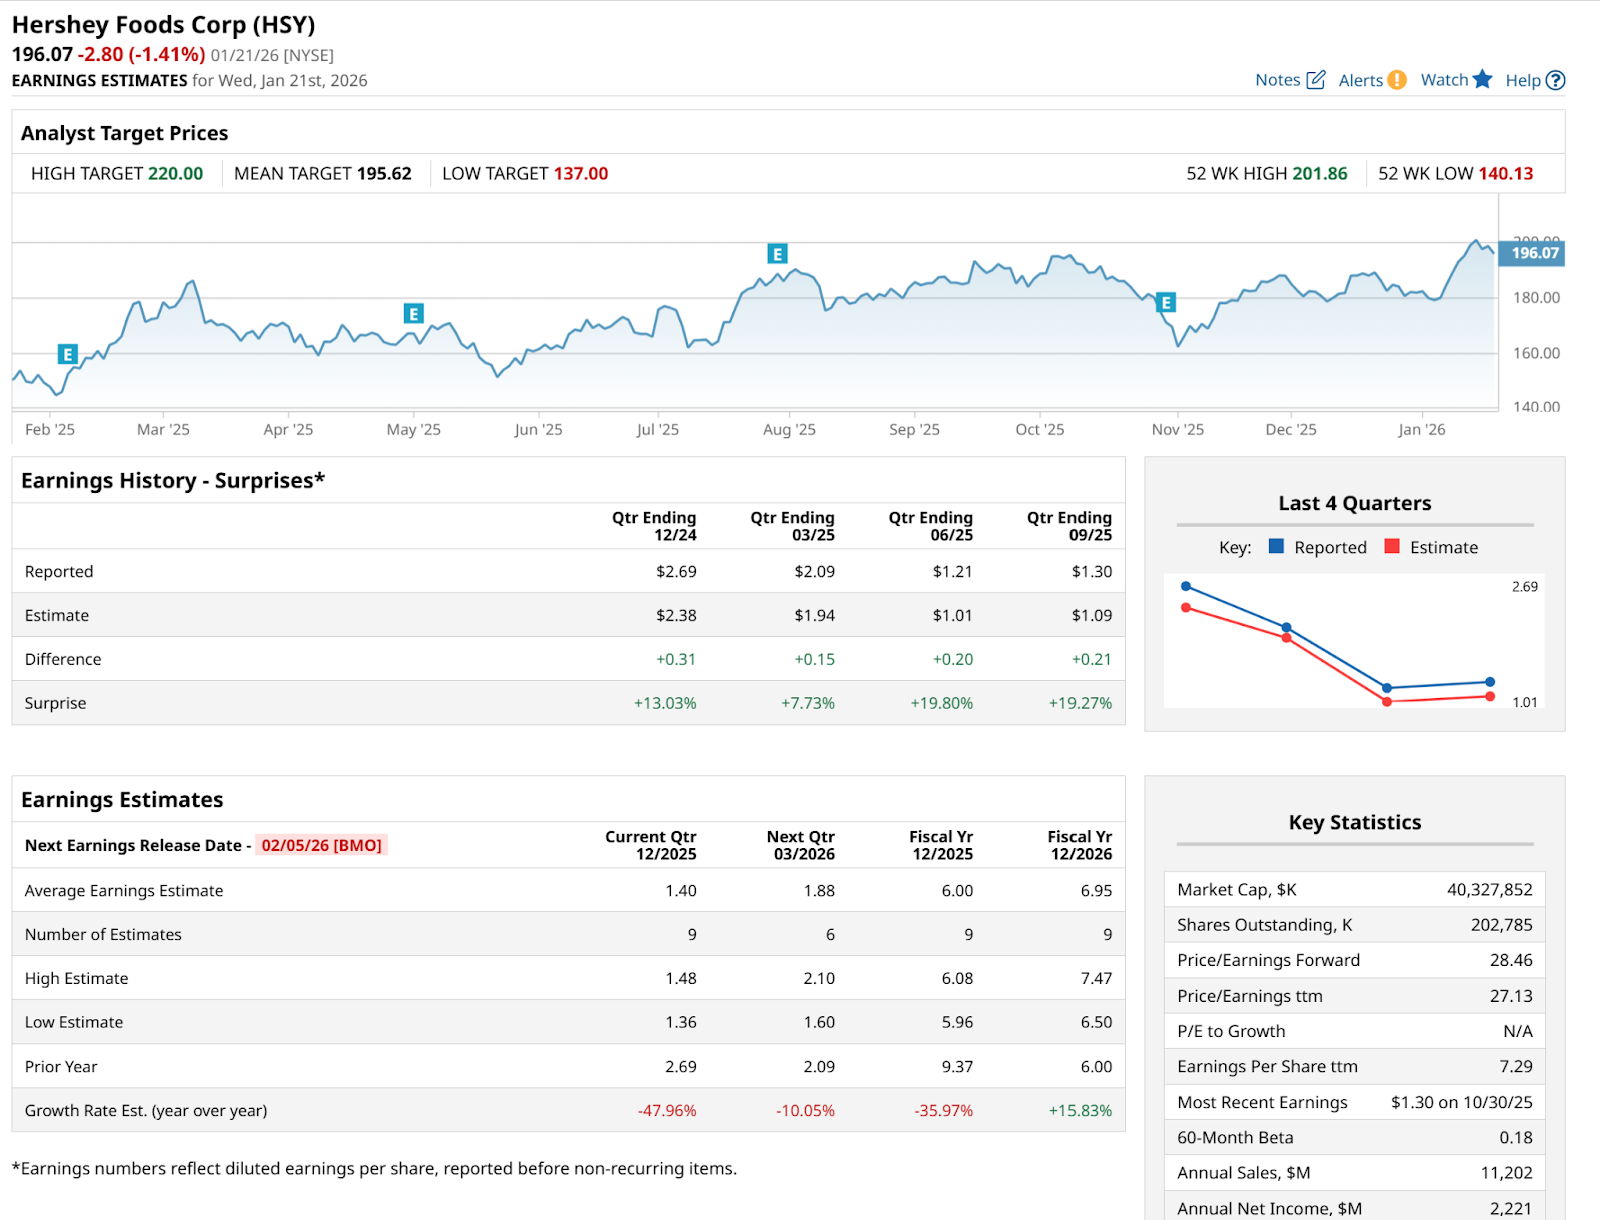
Translation: Upside surprise potential. The charts are hinting at it, but that’s just a positive setup. The price action is what counts.
Rob Isbitts is a semi-retired fiduciary investment advisor and fund manager. Find his investment research at ETFYourself.com. To copy-trade Rob’s portfolios, check out the new PiTrade app. His new blog on racehorse ownership as an alternative asset is at HorseClaiming.com.
On the date of publication, Rob Isbitts did not have (either directly or indirectly) positions in any of the securities mentioned in this article. All information and data in this article is solely for informational purposes. For more information please view the Barchart Disclosure Policy here.
More news from Barchart