Santa Clara, California-based Intel Corporation (INTC) designs, develops, manufactures, markets, and sells computing and related products and services worldwide. Valued at $215.3 billion by market cap, the company’s major products include microprocessors, chipsets, embedded processors and microcontrollers, flash memory, graphic, network and communication, systems management software, conferencing, and digital imaging products.
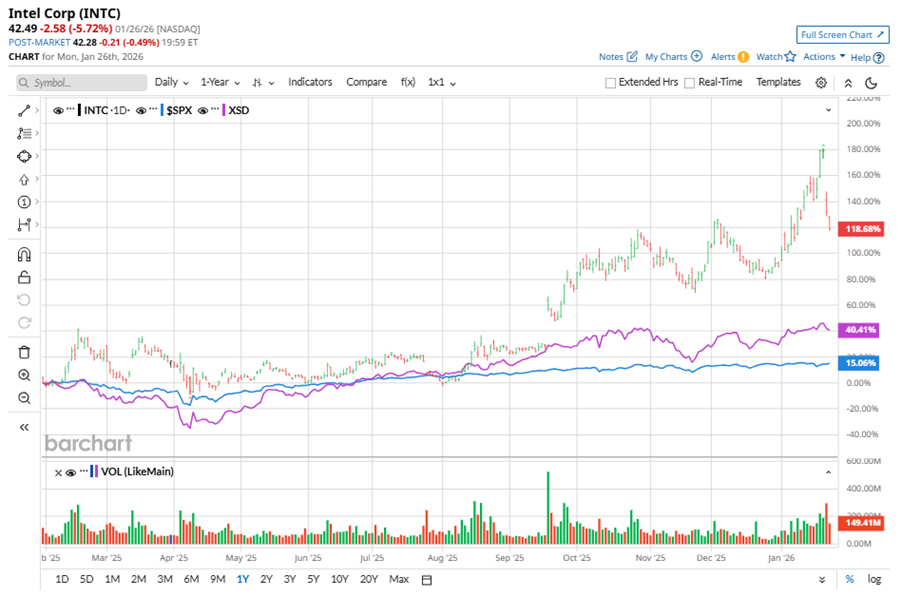
Shares of this leading chipmaker have significantly outperformed the broader market over the past year. INTC has gained 104% over this time frame, while the broader S&P 500 Index ($SPX) has rallied nearly 13.9%. In 2026, INTC’s stock rose 15.2%, surpassing SPX’s 1.5% rise on a YTD basis.
Zooming in further, INTC’s outperformance is also apparent compared to the SPDR S&P Semiconductor ETF (XSD). The exchange-traded fund has gained about 32.5% over the past year. Moreover, INTC’s double-digit returns on a YTD basis outshine the ETF’s 8.6% gains over the same time frame.
INTC's outperformance is driven by strong demand for AI-enabled PCs, servers, and networking solutions. The company's DCAI business is set for strong growth, with rising server capacity demand. Intel's X86 architecture and Core Ultra Series 3 position it well for AI-driven growth, with a large installed base and faster PC refresh cycles expected.
On Jan. 22, INTC reported its Q4 results, and its shares crashed 22.8% in the following two trading sessions. Its adjusted EPS of $0.15 exceeded Wall Street expectations of $0.08. The company’s revenue was $13.7 billion, beating Wall Street forecasts of $13.4 billion. For Q1 2026, INTC expects revenue in the range of $11.7 billion to $12.7 billion.
For the current fiscal year, ending in December, analysts expect INTC’s EPS to grow 241.7% to $0.17 on a diluted basis. The company’s earnings surprise history is mixed. It beat the consensus estimates in three of the last four quarters while missing the forecast on another occasion.
Among the 44 analysts covering INTC stock, the consensus is a “Hold.” That’s based on five “Strong Buy” ratings, one “Moderate Buy,” 33 “Holds,” one “Moderate Sell,” and four “Strong Sells.”
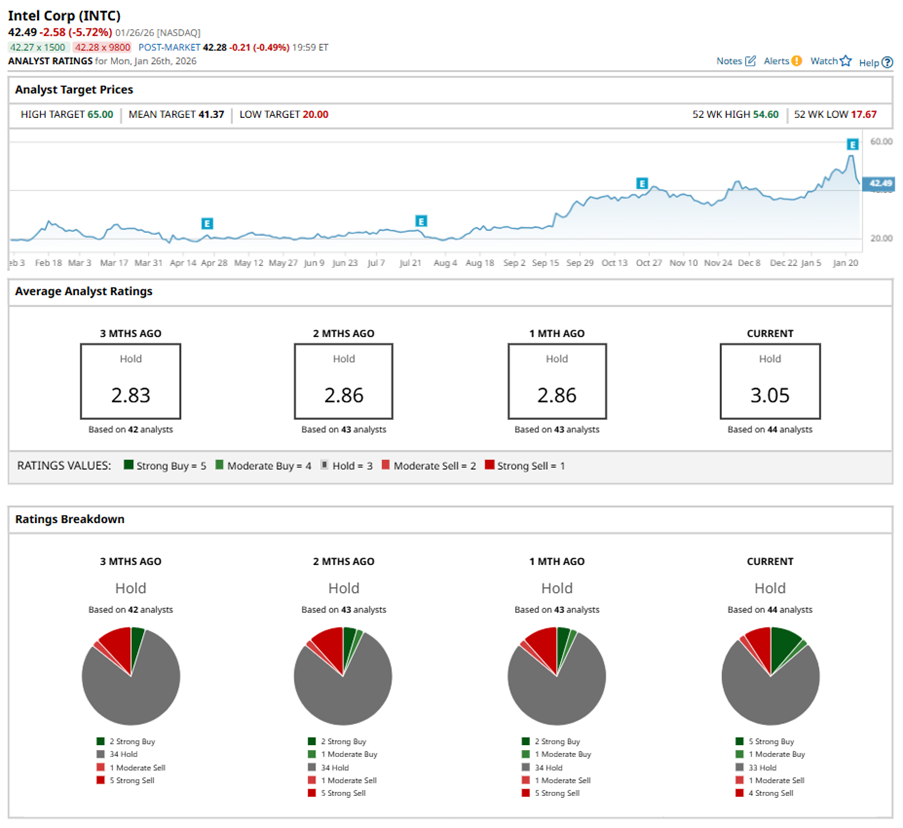
This configuration is more bullish than a month ago, with two analysts suggesting a “Strong Buy,” and five recommending a “Strong Sell.”
On Jan. 23, Truist Financial Corporation (TFC) kept a “Buy” rating on INTC and raised the price target to $49, implying a potential upside of 15.3% from current levels.
While INTC currently trades above its mean price target of $41.37, the Street-high price target of $65 suggests a notable 53% upside potential.
On the date of publication, Neha Panjwani did not have (either directly or indirectly) positions in any of the securities mentioned in this article. All information and data in this article is solely for informational purposes. For more information please view the Barchart Disclosure Policy here.
More news from Barchart
- Why 1 Analyst Just Slashed Their Price Target on Oracle Stock by More than 30%
- Seagate Stock Just Hit a New All-Time High Ahead of Earnings. Should You Chase the AI Frenzy Higher?
- Dear Sandisk Stock Fans, Mark Your Calendars for January 29
- Chinese Tech Giants Receive the OK to ‘Prep’ for H200 Orders. How Should Nvidia Stock Investors Play the Return to China Thesis?