ETFOptimize | High-performance ETF-based Investment Strategies

Quantitative strategies, Wall Street-caliber research, and insightful market analysis since 1998.


ETFOptimize | HOME
Close Window

What to Expect From Xylem's Q4 2025 Earnings Report

Xylem Inc. (XYL), headquartered in Washington, District of Columbia, designs, manufactures, and services engineered products and solutions. With a market cap of $33.4 billion, the company offers water and wastewater pumps, treatment and testing equipment, industrial pumps, valves, heat exchangers, and dispensing equipment. The leading global water technology company is expected to announce its fiscal fourth-quarter earnings for 2025 in the near future. 

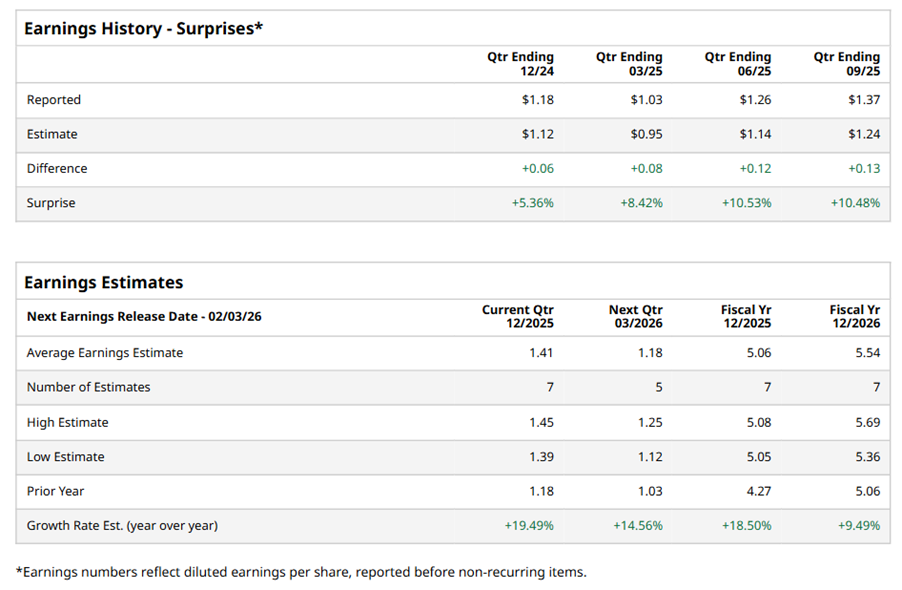
Ahead of the event, analysts expect XYL to report a profit of $1.41 per share on a diluted basis, up 19.5% from $1.18 per share in the year-ago quarter. The company has consistently surpassed Wall Street’s EPS estimates in its last four quarterly reports. 


For the full year, analysts expect XYL to report EPS of $5.06, up 18.5% from $4.27 in fiscal 2024. Its EPS is expected to rise 9.5% year over year to $5.54 in fiscal 2026. 

www.barchart.com

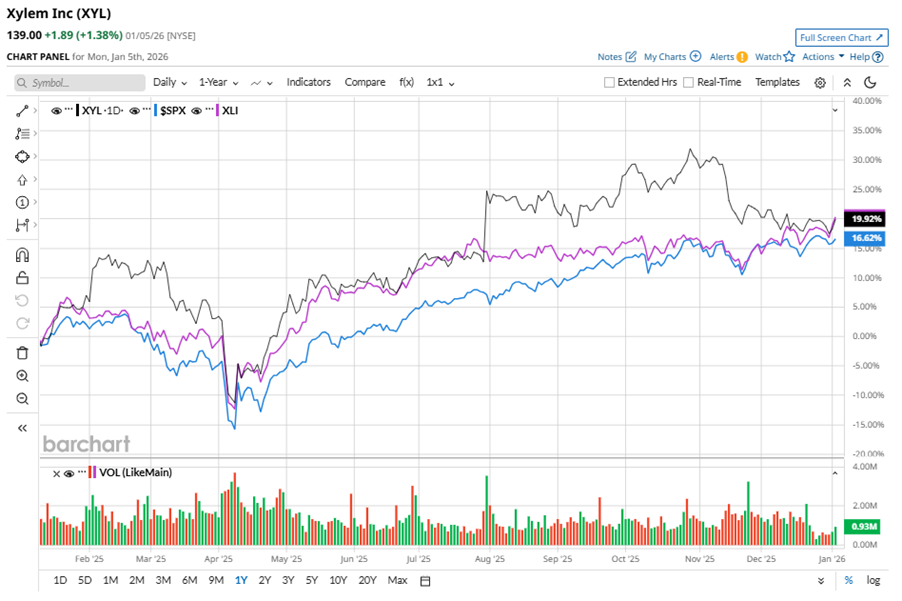
XYL stock has outperformed the S&P 500 Index’s ($SPX16.2% gains over the past 52 weeks, with shares up 18.6% during this period. However, it underperformed the Industrial Select Sector SPDR Fund’s (XLI20.4% gains over the same time frame.

www.barchart.com

Xylem's outperformance is driven by strong demand for water management solutions, successful pricing and productivity gains, and strategic investments. Management expects continued growth, supported by advanced metering infrastructure demand and simplification efforts, despite macro headwinds, and anticipates margin improvement from divesting the international metering business.

On Oct. 28, 2025, XYL shares closed up marginally after reporting its Q3 results. Its adjusted EPS of $1.37 exceeded Wall Street expectations of $1.24. The company’s revenue was $2.3 billion, beating Wall Street's $2.2 billion forecast. XYL expects full-year adjusted EPS in the range of $5.03 to $5.08, and revenue is expected to be $9 billion.

Analysts’ consensus opinion on XYL stock is moderately bullish, with a “Moderate Buy” rating overall. Out of 21 analysts covering the stock, 12 advise a “Strong Buy” rating, one suggests a “Moderate Buy,” and eight give a “Hold.” XYL’s average analyst price target is $169.94, indicating a potential upside of 22.3% from the current levels. 


On the date of publication, Neha Panjwani did not have (either directly or indirectly) positions in any of the securities mentioned in this article. All information and data in this article is solely for informational purposes. For more information please view the Barchart Disclosure Policy here.


More news from Barchart

Recent Quotes

View More
Symbol Price Change (%)
AMZN  247.38
+1.09 (0.44%)
AAPL  259.37
+0.33 (0.13%)
AMD  203.17
-1.51 (-0.74%)
BAC  55.85
-0.33 (-0.59%)
GOOG  329.14
+3.13 (0.96%)
META  653.06
+7.00 (1.08%)
MSFT  479.28
+1.17 (0.24%)
NVDA  184.86
-0.18 (-0.10%)
ORCL  198.52
+9.37 (4.95%)
TSLA  445.01
+9.21 (2.11%)
Stock Quote API & Stock News API supplied by www.cloudquote.io
Quotes delayed at least 20 minutes.
By accessing this page, you agree to the Privacy Policy and Terms Of Service.


IntelligentValue Home
Close Window

DISCLAIMER

All content herein is issued solely for informational purposes and is not to be construed as an offer to sell or the solicitation of an offer to buy, nor should it be interpreted as a recommendation to buy, hold or sell (short or otherwise) any security.  All opinions, analyses, and information included herein are based on sources believed to be reliable, but no representation or warranty of any kind, expressed or implied, is made including but not limited to any representation or warranty concerning accuracy, completeness, correctness, timeliness or appropriateness. We undertake no obligation to update such opinions, analysis or information. You should independently verify all information contained on this website. Some information is based on analysis of past performance or hypothetical performance results, which have inherent limitations. We make no representation that any particular equity or strategy will or is likely to achieve profits or losses similar to those shown. Shareholders, employees, writers, contractors, and affiliates associated with ETFOptimize.com may have ownership positions in the securities that are mentioned. If you are not sure if ETFs, algorithmic investing, or a particular investment is right for you, you are urged to consult with a Registered Investment Advisor (RIA). Neither this website nor anyone associated with producing its content are Registered Investment Advisors, and no attempt is made herein to substitute for personalized, professional investment advice. Neither ETFOptimize.com, Global Alpha Investments, Inc., nor its employees, service providers, associates, or affiliates are responsible for any investment losses you may incur as a result of using the information provided herein. Remember that past investment returns may not be indicative of future returns.

Copyright © 1998-2017 ETFOptimize.com, a publication of Optimized Investments, Inc. All rights reserved.