S&P Global Inc. (SPGI) is a leading financial information and analytics company headquartered in New York. The firm provides credit ratings, benchmarks, data, and analytical solutions through key business segments, including S&P Global Market Intelligence, S&P Global Ratings, S&P Global Energy, S&P Global Mobility, and S&P Dow Jones Indices. Its services help investors, corporations, and governments assess risk, benchmark performance, and make informed decisions across financial markets. S&P Global commands a market cap of about $122.4 billion.
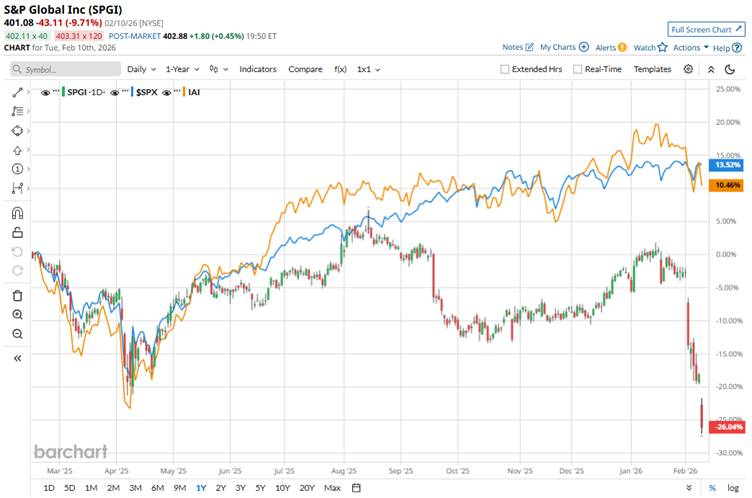
Shares of this leading credit rating agency have underperformed the broader market over the past year. SPGI has dipped 22.2% over this time frame, while the broader S&P 500 Index ($SPX) has rallied 14.4%. The trend has continued in 2025, with the stock slumping 23.3% while the SPX has climbed 1.4% year-to-date.
Drilling down further, the stock has also lagged behind the iShares U.S. Broker-Dealers & Securities Exchanges ETF (IAI), which has gained about 12.4% over the past year and declined 2.1% on a YTD basis.
S&P Global’s share price is under pressure amid the company’s latest earnings results and growth outlook, which came in below Wall Street expectations, triggering a broad sell-off.
For the fourth quarter ended Dec. 31, 2025, S&P Global reported revenue of $3.9 billion, representing about 9% year-over-year growth, while adjusted earnings per share increased 14% to $4.30, narrowly missing the consensus forecast. Also, the company’s 2026 profit forecast came in below Wall Street expectations.
Additionally, worries about how AI-driven disruption and structural industry changes might impact demand for traditional financial data services have contributed to bearish sentiment. The stock has slumped as much as 9.7% in the last trading session.
For the current fiscal year, analysts expect SPGI’s EPS to grow 11.2% to $19.84 on a diluted basis. The company’s earnings surprise history is impressive. It beat the consensus estimate in each of the last four quarters.
Among the 26 analysts covering SPGI stock, the consensus is a “Strong Buy.” That’s based on 20 “Strong Buy” ratings, three “Moderate Buys,” and three “Holds.”
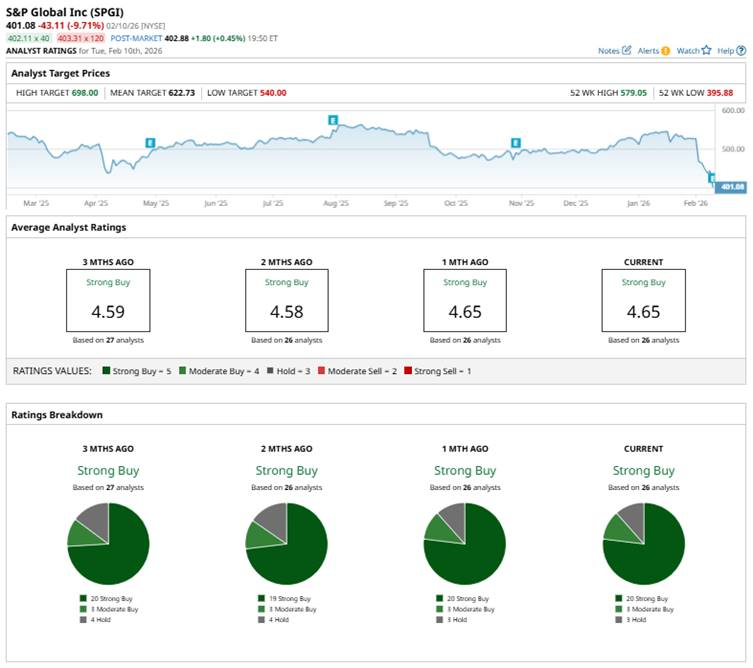
This configuration is slightly more bullish than two months ago, when there were 19 “Strong Buy” ratings.
Last month, Stifel reaffirmed its “Buy” rating and $599 price target on S&P Global, citing expectations for strong debt issuance in 2026.
The mean price target of $622.73 represents a 55.3% premium to SPGI’s current price levels. The Street-high price target of $698 suggests an upside potential of 74%.
On the date of publication, Subhasree Kar did not have (either directly or indirectly) positions in any of the securities mentioned in this article. All information and data in this article is solely for informational purposes. For more information please view the Barchart Disclosure Policy here.
More news from Barchart
- This Is the Top-Rated Dividend Stock to Buy in February 2026
- No, AI Isn’t Killing Software: OKTA & More Top Stocks to Pull from the Ashes of ‘SaaS-pocalypse’
- 'If People in the Rest of the World Knew What I Know': MicroStrategy's Michael Saylor's Viral Message About MSTR Stock and Bitcoin to $10 Million
- As Upwork Plunges Below Key Support Levels, Should You Buy the UPWK Stock Dip?


