NVIDIA Corporation (NVDA), headquartered in Santa Clara, California, is a pioneer in gaming GPUs and now leads AI and accelerated computing with a $4.61 trillion market cap. Its data center business surges due to strong demand for Hopper and Blackwell GPUs in AI training and inference, as cloud providers and enterprises ramp up infrastructure investments that exceed supply.
NVDA’s shares had reached a 52-week high of $212.19 on Oct. 29, 2025, but are down 9.7% from that level. Due to sustained AI demand for its GPUs outpacing supply, the stock has recently experienced modest gains (by its standards). Over the past three months, the stock has gained 7.1%. On the other hand, its mega-cap peers, as shown by the Vanguard Mega Cap Index Fund (MGC), are up 2.4% over the same period.
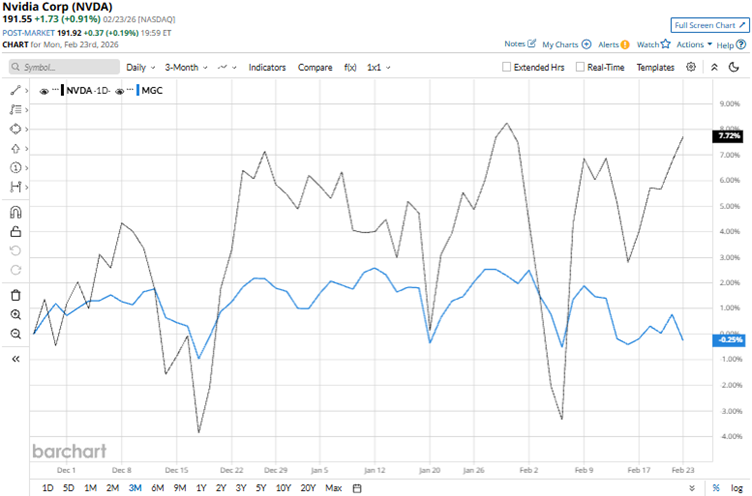
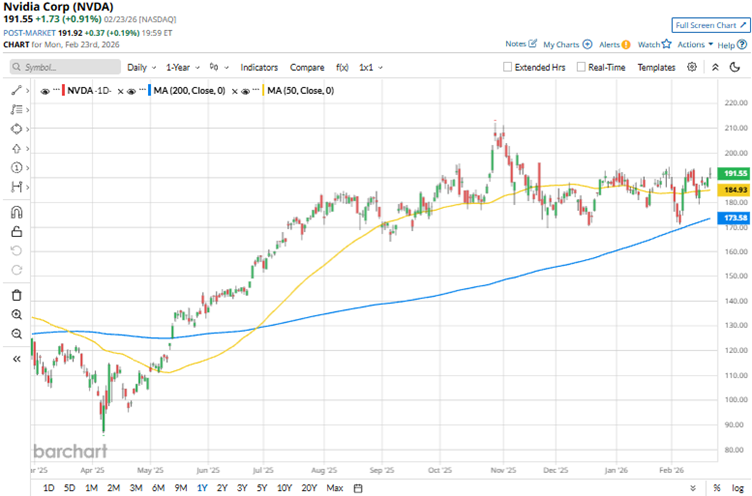
Over a more extended period, this outperformance persists. Over the past 52 weeks, NVDA’s stock has increased by 42.5%, while it has been up 2.7% year-to-date (YTD). Contrarily, the Vanguard Mega Cap Index Fund has gained 13.9% over the past 52 weeks but is down 1.3% YTD. The stock has traded above its 200-day moving average since mid-May 2025 and is currently hovering near its 50-day moving average.
NVDA remains at the center of the AI spending spree, as its GPUs remain the most coveted technology in the market. Recently, the company entered into a multi-year structural partnership with Meta Platforms, Inc. (META) to build AI infrastructure. This positions NVDA as a primary beneficiary of the social media giant’s massive planned spending this year. Its stock gained 1.2% intraday on Feb. 17 and 1.6% on Feb. 18 on the news.
In the last reported quarter, NVIDIA’s data center revenue increased 66% year-over-year (YOY) to a record $51.20 billion, signaling the company’s prowess when it comes to AI-related operations. Now, the market is awaiting its Q4 FY2026 results (to be reported on Feb. 25, after the market closes). Wall Street analysts expect the company’s EPS to climb 70.6% YOY to $1.45 for Q4.
We compare NVDA’s performance with that of another mega-cap semiconductor stock, Advanced Micro Devices, Inc. (AMD), which has gained 77.4% over the past 52 weeks. Therefore, NVDA has been the clear underperformer over the past year.
Wall Street analysts are strongly bullish on NVDA’s stock. The stock has a consensus rating of “Strong Buy” from the 50 analysts covering it. The mean price target of $255.55 implies a 33.4% upside from current levels. The Street-high price target of $352 indicates an 83.8% upside.
On the date of publication, Anushka Dutta did not have (either directly or indirectly) positions in any of the securities mentioned in this article. All information and data in this article is solely for informational purposes. For more information please view the Barchart Disclosure Policy here.
More news from Barchart