ETFOptimize | High-performance ETF-based Investment Strategies

Quantitative strategies, Wall Street-caliber research, and insightful market analysis since 1998.


ETFOptimize | HOME
Close Window

Is RTX Corporation Stock Outperforming the Nasdaq?

Arlington, Virginia-based RTX Corporation (RTX) is an aerospace and defense company that provides systems and services for commercial, military, and government customers worldwide. The company has a market capitalization of $266.4 billion and operates through Collins Aerospace (Collins), Pratt & Whitney, and Raytheon segments.

Companies with a market cap of $200 billion or more are typically referred to as "mega-cap stocks." RTX firmly belongs in that category. With a market cap comfortably above this mark, RTX stands as a powerhouse in the aerospace and defense industry, ranking among the top companies that supply systems and services to both the United States and global governments.


However, the stock currently trades 4% below its 52-week high of $206.73 recorded on Feb. 19. RTX has gained 14.6% over the past three months, notably outperforming the Nasdaq Composite’s ($NASX) marginal slip during the same time frame.

www.barchart.com

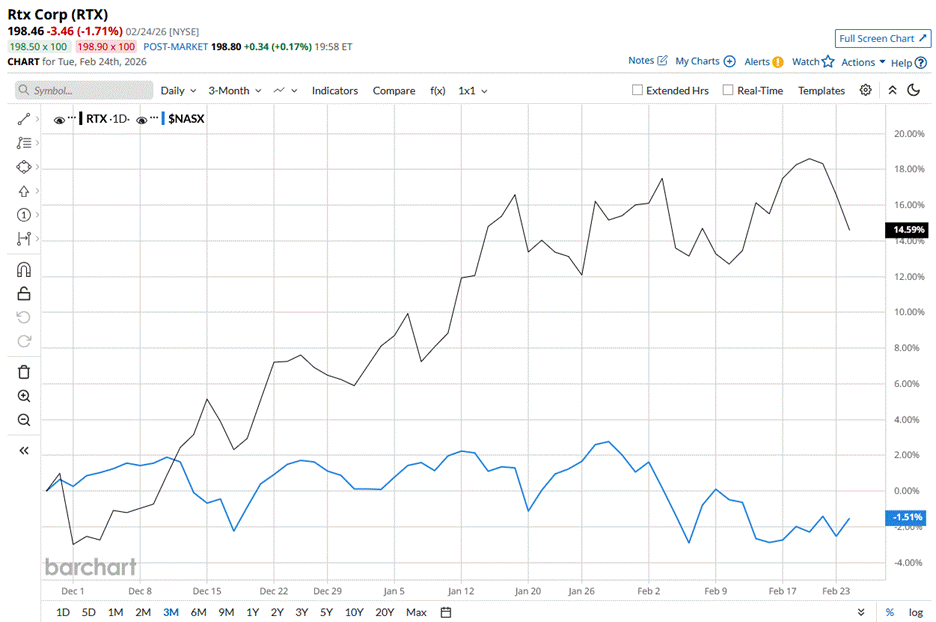
In the longer term, RTX has delivered a standout performance. The stock rallied 58.2% over the past 52 weeks, comfortably outpacing the 18.6% return of NASX over the same period.

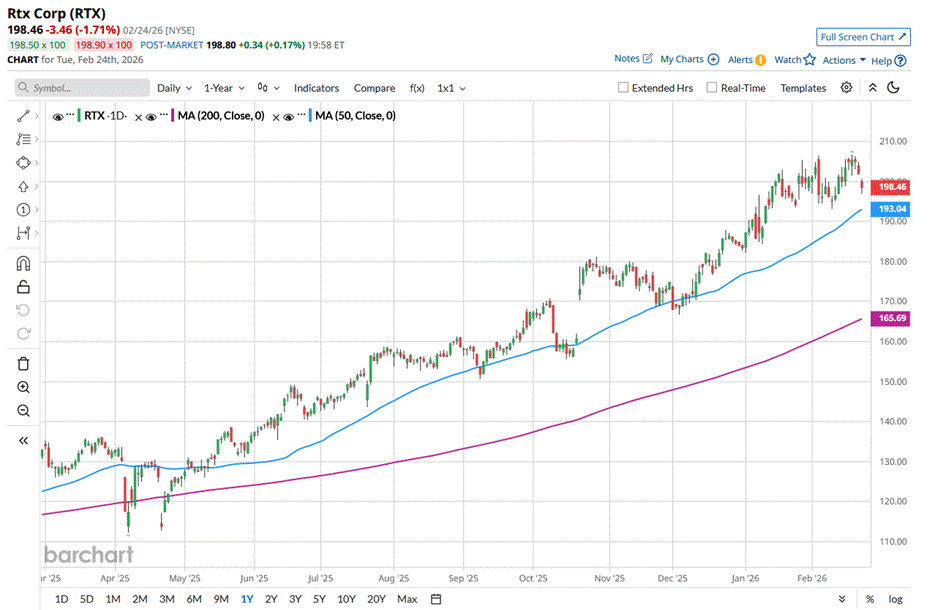
Additionally, the stock has been showing steady bullish momentum. RTX has been trading above its 200-day moving average since April last year and above its 50-day moving average since May wih slight fluctuations. This consistent momentum highlights the stock’s resilience and supports its strong performance compared with the broader market.

www.barchart.com

On Jan. 27, RTX shares grew 3.7% following the release of its better-than-expected Q4 2025 earnings. The company’s revenue increased 12.1% year-over-year to $24.2 billion and surpassed the Street’s estimates. Moreover, its adjusted EPS for the quarter amounted to $1.55, also coming on top of Wall Street estimates. 

Competition within the aerospace and defense space has been equally intense. When stacked against its closest peer, GE Aerospace (GE) has climbed 73.9% over the past year, decisively outpacing RTX Corporation’s strong rally.

Wall Street continues to view the stock favorably. Among the 22 analysts tracking RTX, the overall consensus stands at a “Moderate Buy.” Plus, its mean price target of $215.19 suggests 8.4% upside potential from current price levels.


On the date of publication, Sristi Jayaswal did not have (either directly or indirectly) positions in any of the securities mentioned in this article. All information and data in this article is solely for informational purposes. For more information please view the Barchart Disclosure Policy here.


More news from Barchart

Recent Quotes

View More
Symbol Price Change (%)
AMZN  214.33
+0.84 (0.39%)
AAPL  260.83
+0.95 (0.37%)
AMD  203.23
+0.55 (0.27%)
BAC  48.56
+0.66 (1.38%)
GOOG  306.93
+0.92 (0.30%)
META  654.07
+6.68 (1.03%)
MSFT  405.76
-3.65 (-0.89%)
NVDA  184.77
+2.12 (1.16%)
ORCL  149.40
-2.16 (-1.43%)
TSLA  399.24
+0.56 (0.14%)
Stock Quote API & Stock News API supplied by www.cloudquote.io
Quotes delayed at least 20 minutes.
By accessing this page, you agree to the Privacy Policy and Terms Of Service.


IntelligentValue Home
Close Window

DISCLAIMER

All content herein is issued solely for informational purposes and is not to be construed as an offer to sell or the solicitation of an offer to buy, nor should it be interpreted as a recommendation to buy, hold or sell (short or otherwise) any security.  All opinions, analyses, and information included herein are based on sources believed to be reliable, but no representation or warranty of any kind, expressed or implied, is made including but not limited to any representation or warranty concerning accuracy, completeness, correctness, timeliness or appropriateness. We undertake no obligation to update such opinions, analysis or information. You should independently verify all information contained on this website. Some information is based on analysis of past performance or hypothetical performance results, which have inherent limitations. We make no representation that any particular equity or strategy will or is likely to achieve profits or losses similar to those shown. Shareholders, employees, writers, contractors, and affiliates associated with ETFOptimize.com may have ownership positions in the securities that are mentioned. If you are not sure if ETFs, algorithmic investing, or a particular investment is right for you, you are urged to consult with a Registered Investment Advisor (RIA). Neither this website nor anyone associated with producing its content are Registered Investment Advisors, and no attempt is made herein to substitute for personalized, professional investment advice. Neither ETFOptimize.com, Global Alpha Investments, Inc., nor its employees, service providers, associates, or affiliates are responsible for any investment losses you may incur as a result of using the information provided herein. Remember that past investment returns may not be indicative of future returns.

Copyright © 1998-2017 ETFOptimize.com, a publication of Optimized Investments, Inc. All rights reserved.