With a market cap of $234.2 billion, Intel Corporation (INTC) is a global technology company that designs, develops, manufactures, and sells computing and related products and services across the United States and internationally. It serves OEMs, cloud service providers, and other technology partners through a broad global sales and distribution network.
Companies valued over $200 billion are generally described as “mega-cap” stocks, and Intel fits right into that category. Operating through its CCG, DCAI, and Intel Foundry segments, Intel offers client and server CPUs, GPUs, AI and data center solutions, connectivity products, and semiconductor manufacturing services.
Shares of the Santa Clara, California-based company have fallen 14.1% from its 52-week high of $54.60. Intel’s shares have climbed 30.8% over the past three months, surpassing the broader Nasdaq Composite’s ($NASX) marginal gain over the same time frame.
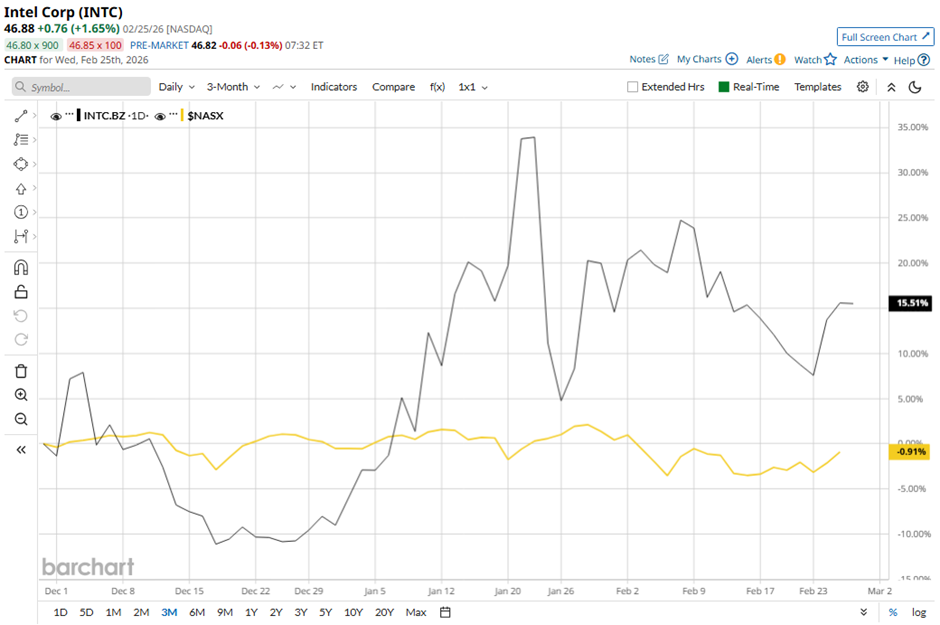
In the longer term, shares of the company have soared 103.9% over the past 52 weeks, compared to NASX’s 21.7% return over the same time frame. Moreover, INTC stock is up 27.1% on a YTD basis, exceeding NASX’s marginal decline.
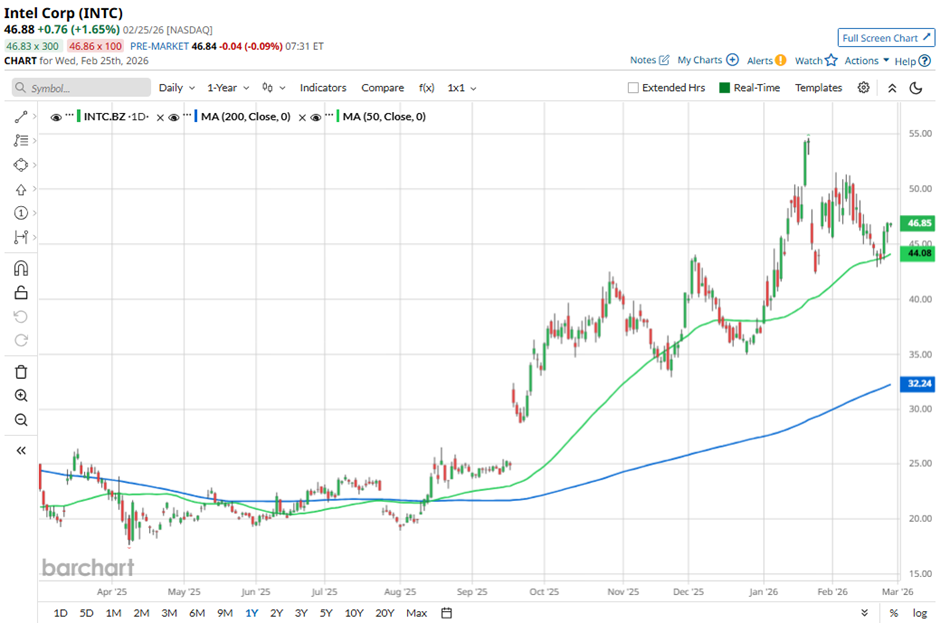
The stock has been trading above its 50-day and 200-day moving averages since mid August 2025.
Shares of INTC tumbled 17% following its Q4 2025 results on Jan. 22 as the company reported a Q4 EPS loss of $(0.12) and issued Q1 2026 guidance for a wider EPS loss of $(0.21), alongside revenue guidance of $11.7 billion - $12.7 billion. The selloff was compounded by declining Q4 gross margin (36.1%, down 3.1 ppts year-over-year), a 4% year-over-year revenue drop to $13.7 billion, and concerns that supply constraints and heavy investment in Intel 18A and foundry expansion will weigh on results before benefits materialize.
In comparison, rival Apple Inc. (AAPL) has lagged behind INTC stock. AAPL stock has risen marginally on a YTD basis and 11% over the past 52 weeks.
Despite the stock’s strong performance over the past year, analysts remain cautious on INTC. It has a consensus rating of “Hold” from the 45 analysts in coverage, and as of writing, the stock is trading above the mean price target of $45.26.
On the date of publication, Sohini Mondal did not have (either directly or indirectly) positions in any of the securities mentioned in this article. All information and data in this article is solely for informational purposes. For more information please view the Barchart Disclosure Policy here.
More news from Barchart
- New Lab-Grown Meat Breakthrough Beats Traditional Beef by a Mile With 90% Less Land Use, 80% Less Water, and Dramatically Lower Emissions
- Microsoft Is Teaming up With Starlink. What Does That Mean for MSFT Stock?
- Nvidia’s Q4 Results Underscore a Major Identity Crisis in Software Stocks
- 1 Stock to Buy Now as Experts Warn of a Looming Uranium Supply Crunch