Picture this: You love the idea of owning the very best stocks, the ones with wide moats. That means they are insulated from competition, either because their business is tough to replicate or not easy to switch from, or for other factors that make them a confirmed leader in their space.
The trouble is, they are still stocks. They can get busted any time, even if their market cap is more than $2 trillion. Amazon (AMZN) is one of those stocks.
And while buying it down 20% from its high set in late 2025 makes it look “cheap” given its immense corporate footprint, any stock can fall for any reason. And by any amount.
That makes a stock like AMZN a strong collar candidate. Let’s review the narrative, then check out a collar example for investors who would like to own it in size, but not without a net.
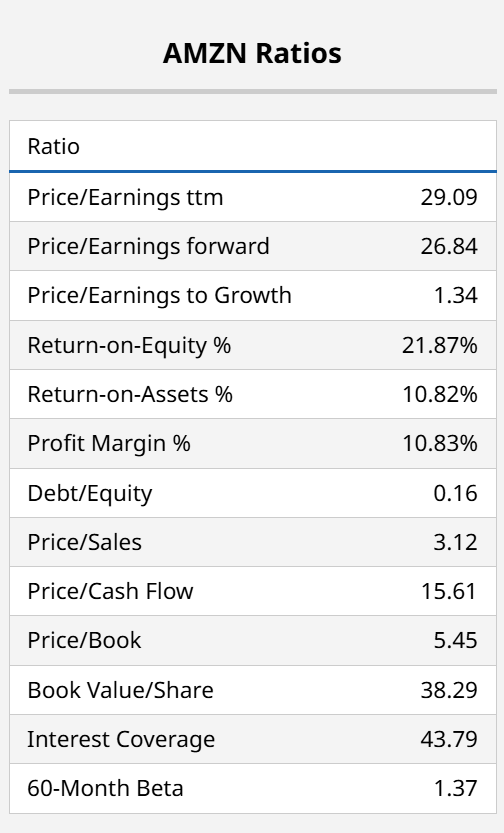
The stock still sells at a premium multiple. However, at only 1.3x its earnings growth rate, it could be argued that the stock is inexpensive on that count.
Over the past two decades, Amazon has fundamentally shifted its narrative from a disruptive e-commerce player to effectively an infrastructure utility for both consumers and enterprises. That has never been more evident than the company’s plans to spend $200 billion, primarily on Amazon Web Services (AWS) capacity and custom artificial intelligence (AI) silicon.
Despite the heavy spending, AWS revenue is growing at a 24% annual clip, exceeding $35 billion last quarter. The North American retail segment is seeing continued margin expansion through the integration of humanoid robotics in fulfillment centers and the growth of high-margin advertising revenue.
Beyond those legacy businesses, Amazon is aggressively scaling Leo, its satellite internet service intended to compete with Starlink by the end of 2026, and integrating primary care services through its One Medical acquisition.
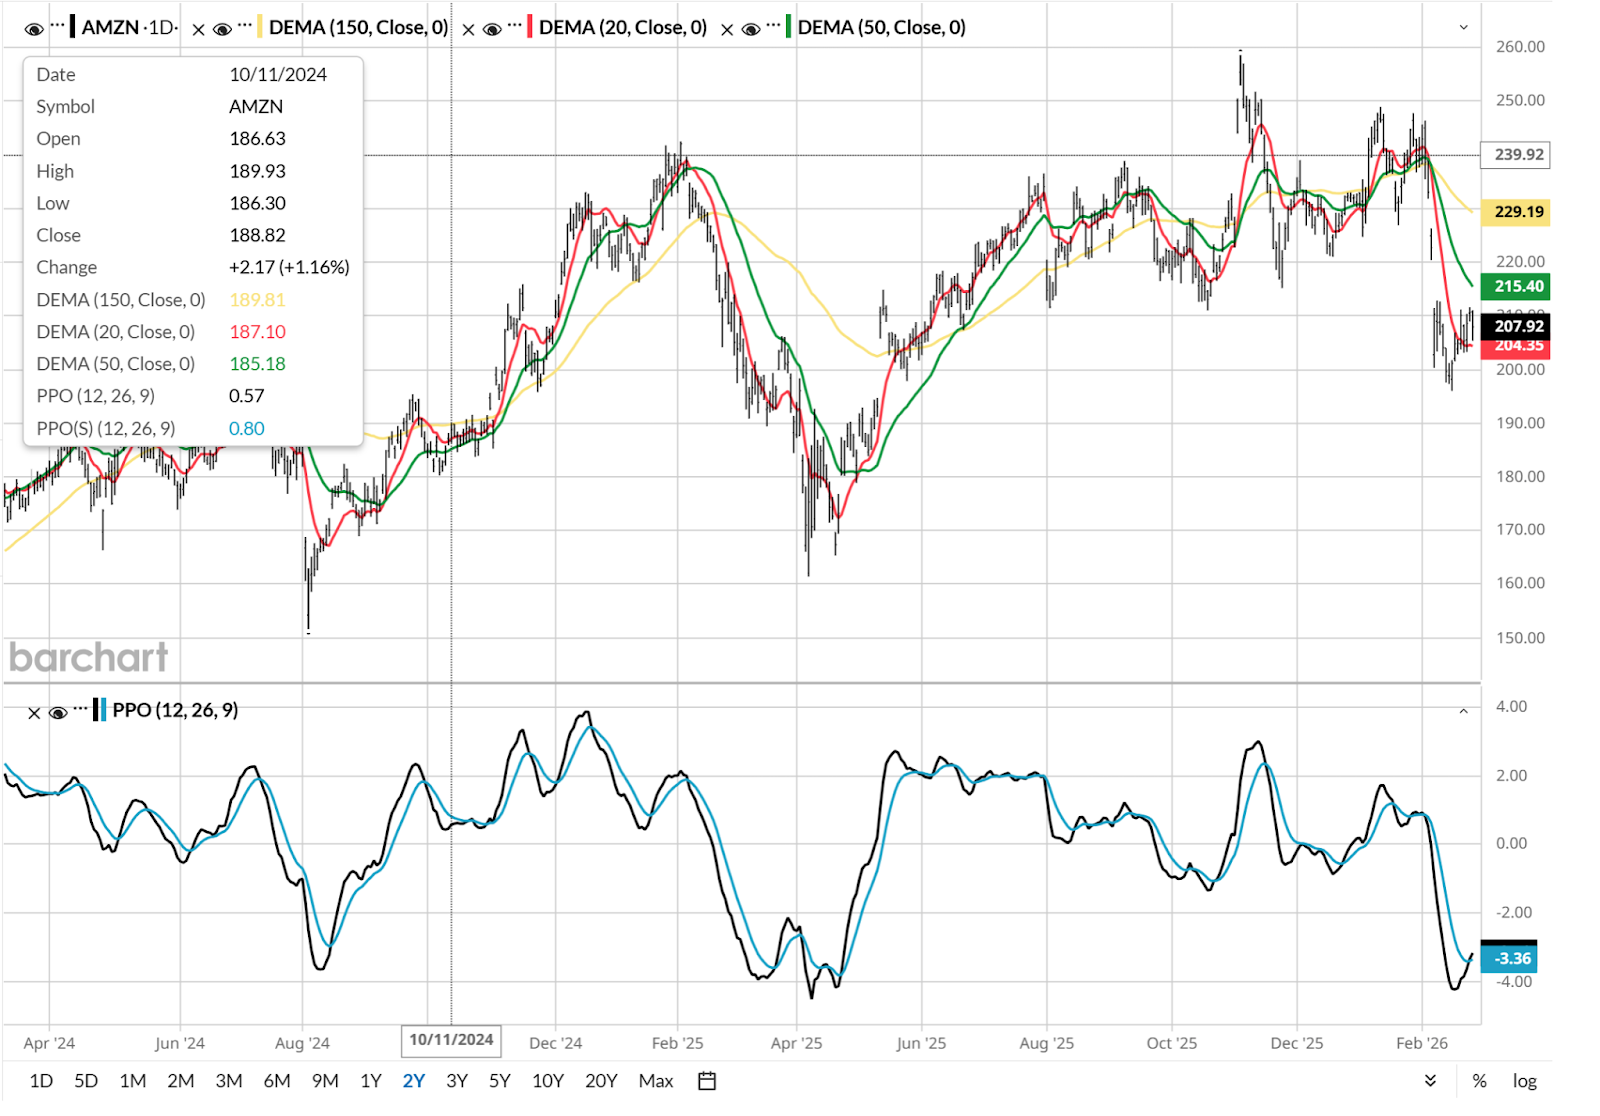
Amazon’s Chart Shows a Mixed Picture
That capital expenditure is considered daunting by many on Wall Street, and the stock’s decline has reflected that. Still, in this chart, I see a very positive sign in the bottoming PPO momentum indicator.
However, the weekly chart is more problematic. The 20-week moving average and PPO are both sinking slowly. That argues for some type of hedged approach for those who own the stock.
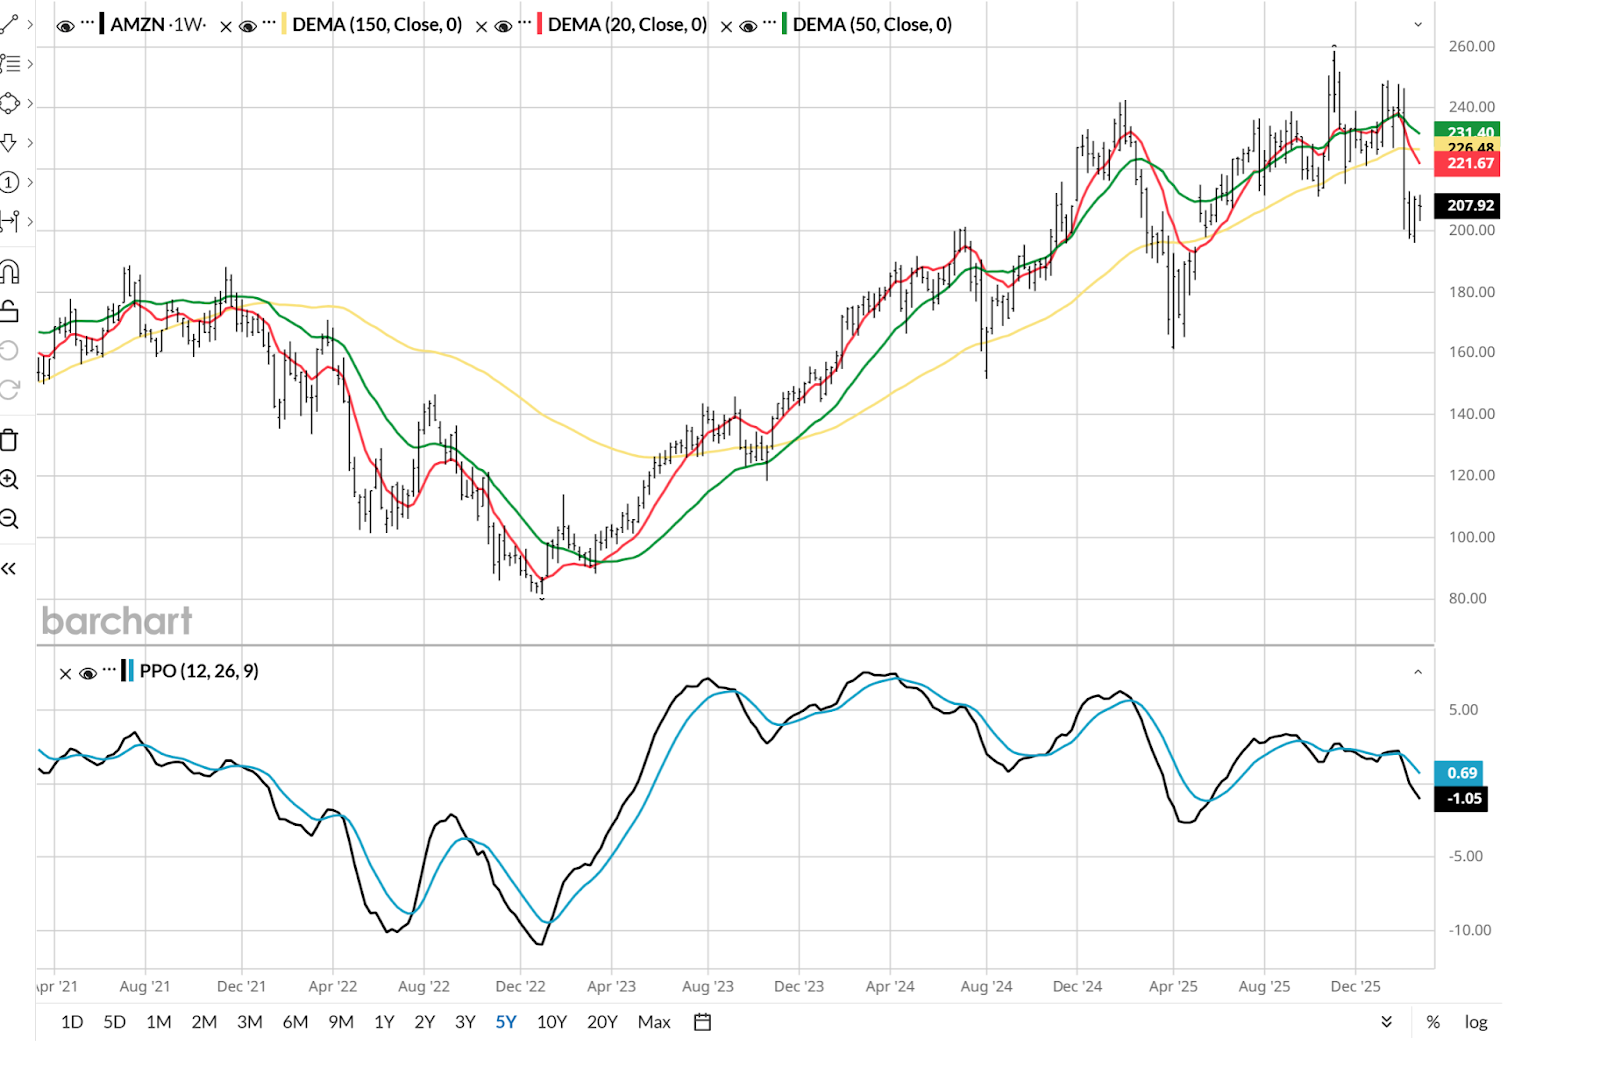
And while that could be as simple as buying less than normal position size to leg into full portfolio position, I have another idea. The same one I’ve had dozens of times here: an option collar.
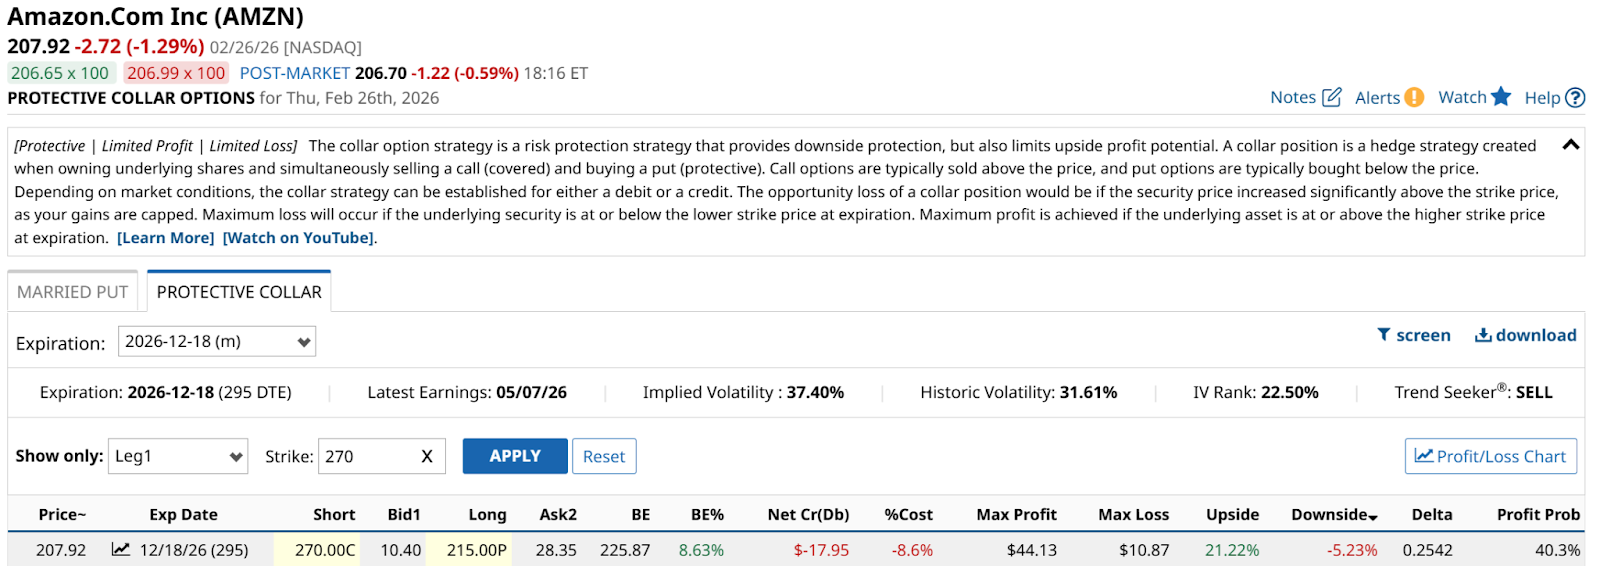
The one I drilled down to is shown above. The call strike price at $270 allows for 21% upside between now and Dec. 18. That’s more than 1% a month potentially. The put strike at $215 is about $7 a share above the current price, which offsets some of the net option premium paid. The bottom line is that the downside here is only about 5%.
A 4:1 up-down ratio is always acceptable to me. And, in this case, it is a risk-managed way to participate in a potential rebound in AMZN during this calendar year. To me, the best way to be an aggressive investor or trader is to do so in ways that still allow me to define my worst-case outcome.
The collar sets that in advance. Because no matter how great a business AMZN is, it is still a stock. And stocks can decline in value, a lot.
Rob Isbitts created the ROAR Score, based on his 40+ years of technical analysis experience. ROAR helps DIY investors manage risk and create their own portfolios. For Rob's written research, check out ETFYourself.com.
On the date of publication, Rob Isbitts did not have (either directly or indirectly) positions in any of the securities mentioned in this article. All information and data in this article is solely for informational purposes. For more information please view the Barchart Disclosure Policy here.
More news from Barchart