PACCAR Inc (PCAR), based in Bellevue, Washington, focuses on designing and building light, medium, and heavy-duty trucks through brands like Kenworth, Peterbilt, and DAF. It further offers parts, financing options, and specialized engines. The company has a market capitalization of $64.55 billion.
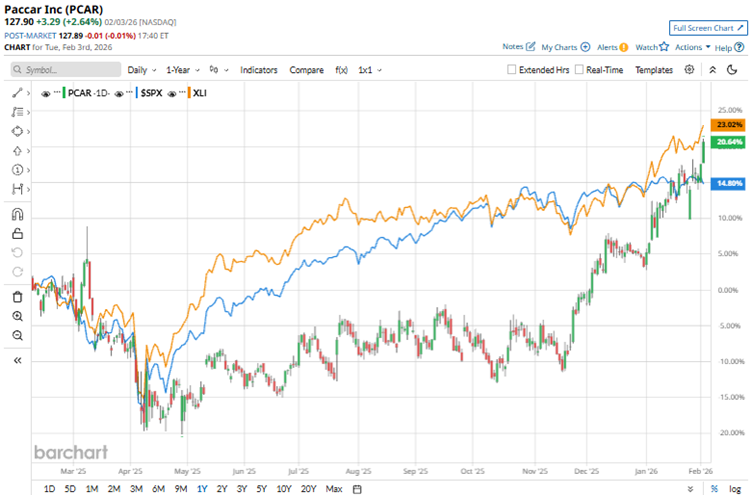
Improving sentiments have given a boost to PCAR’s stock. Over the past 52 weeks, the company’s stock has gained 17.2%, and it is up 16.8% year-to-date (YTD). It climbed to reach a 52-week high of $128.42 on Feb. 3, and is only down slightly from that level.
The S&P 500 index ($SPX) is up 15.4% over the past 52 weeks, indicating the stock has outperformed the broader market during this period. On a YTD basis, this outperformance is more pronounced, as the index is up only 1.1%. Next, we compare the stock’s performance with that of its sector. The State Street Industrial Select Sector SPDR ETF (XLI) has increased 23.3% over the past 52 weeks, outperforming PCAR, while it has rallied 8.9% YTD, underperforming the stock.
On Jan. 27, PCAR reported better-than-expected Q4 and fiscal 2025 results, despite reporting a topline decline. The company’s quarterly sales and revenues declined 13.7% year-over-year (YOY) to $6.82 billion, exceeding the $6.66 billion analysts had expected.
The sales decline was primarily attributable to PCAR’s truck segment, which is experiencing a setback due to a challenging North American freight market, changing emission policies, and the imposition of the Section 232 truck tariff, which created some short-term friction. However, the company’s parts and financial services businesses partially offset that decline.
For the current quarter, Wall Street analysts expect PCAR’s EPS to decline 20.6% YOY to $1.16 on a diluted basis. However, EPS is expected to increase 10.6% annually to $5.54 for fiscal 2026, followed by a 24.4% improvement to $6.89 in fiscal 2027.
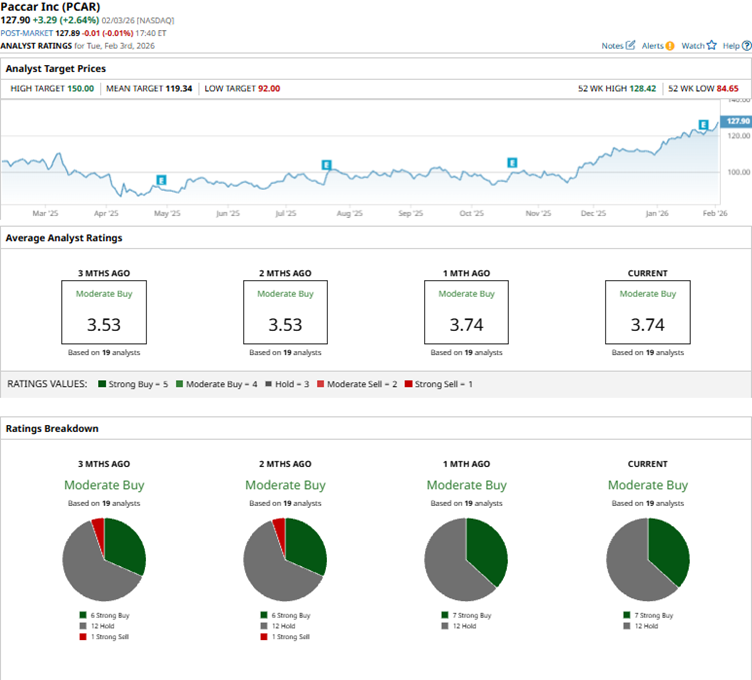
Among the 19 Wall Street analysts covering PCAR’s stock, the consensus is a “Moderate Buy.” That’s based on seven “Strong Buy” ratings and 12 “Holds.” The ratings configuration has become more bullish than two months ago, with seven “Strong Buy” ratings, up from six.
Anticipating a recovery, analysts at JPMorgan upgraded PCAR’s stock from “Neutral” to “Overweight” in December. In January, JPMorgan analyst Tami Zakaria reaffirmed the “Overweight” rating and raised the price target from $133 to $142.
PCAR’s mean price target of $119.34 indicates a 6.7% downside over current market prices. However, the Street-high price target of $150 implies a potential upside of 17.3%.
On the date of publication, Anushka Dutta did not have (either directly or indirectly) positions in any of the securities mentioned in this article. All information and data in this article is solely for informational purposes. For more information please view the Barchart Disclosure Policy here.
More news from Barchart