ETFOptimize | High-performance ETF-based Investment Strategies

Quantitative strategies, Wall Street-caliber research, and insightful market analysis since 1998.


ETFOptimize | HOME
Close Window

Is Corteva Stock Underperforming the Nasdaq?

With a market cap of $52.7 billion, Corteva, Inc. (CTVA) is an agriculture company, serving markets across North America, Latin America, Asia Pacific, Europe, the Middle East, and Africa. The company operates through two main segments: Seed and Crop Protection, developing advanced seed genetics, traits, and crop protection products to help improve farm productivity and resilience. 

Companies worth more than $10 billion are generally labeled as “large-cap” stocks and Corteva fits this criterion perfectly. It also provides herbicides, insecticides, nitrogen stabilizers, and digital farming solutions that support farmers in optimizing crop yield and profitability.


Shares of the Indianapolis, Indiana-based company have decreased 3.9% from its 52-week high of $80.90. Corteva's shares have increased 18.6% over the past three months, outpacing the Nasdaq Composite’s ($NASX) 4% decline over the same time frame.

www.barchart.com

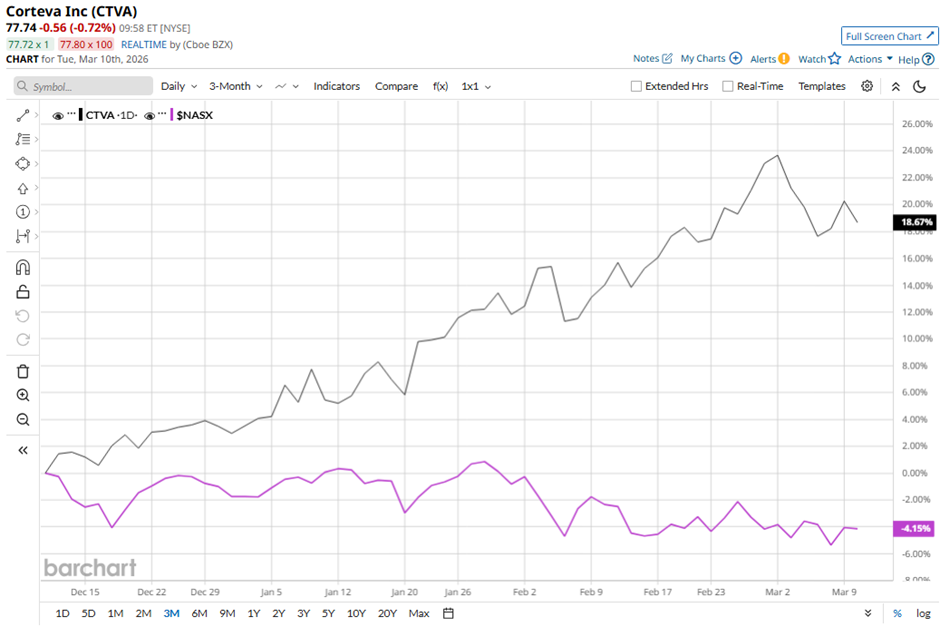
CTVA stock is up 15.1% on a YTD basis, outperforming NASX’s 2.3% drop. However, longer term, shares of the agricultural technology company have returned 28.1% over the past 52 weeks, lagging behind NASX’s 30% return over the same time frame.

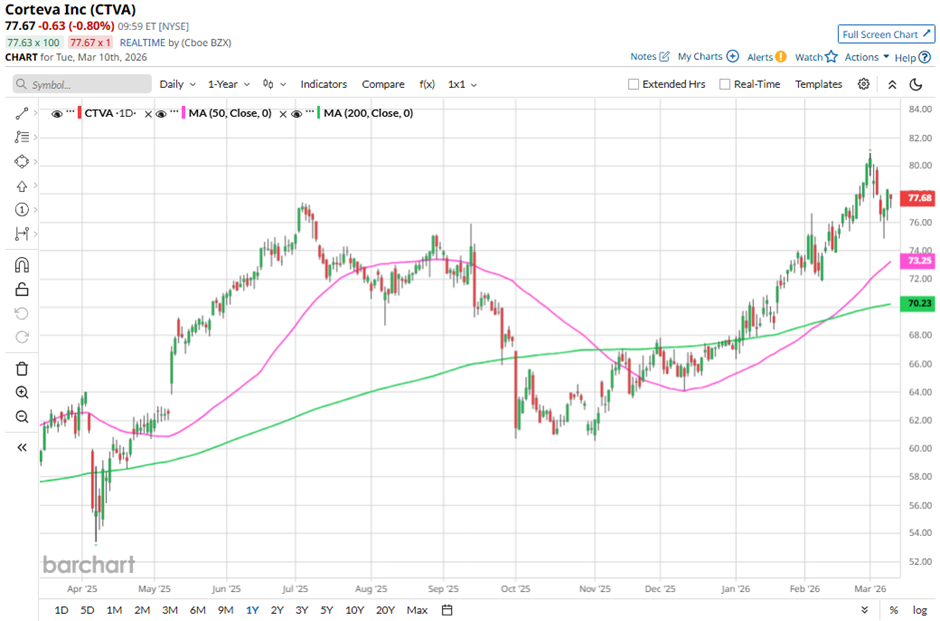
The stock has been trading above its 50-day moving average since late November 2025.

www.barchart.com

Shares of Corteva rose marginally following its Q4 2025 results on Feb. 3 as adjusted EPS of $0.22 matched Wall Street expectations. The company also highlighted strong full-year performance, reporting $1.20 billion in income ($1.75 per share) on $17.40 billion in sales, while operating cash flow jumped 51% to $3.5 billion and free cash flow rose 69% to $2.9 billion. 

In addition, management maintained a 2026 outlook of $4 billion to $4.2 billion in operating EBITDA and $3.45 to $3.70 in operating EPS, supporting investor confidence despite quarterly revenue of $3.91 billion falling short of the consensus estimate.

In comparison, rival CF Industries Holdings, Inc. (CF) has surpassed CTVA stock. Shares of CF Industries have surged 42% over the past 52 weeks and 41.6% on a YTD basis.

Despite CTVA stock’s underperformance over the past year, analysts are moderately optimistic about its prospects. The stock has a consensus rating of “Moderate Buy” from the 22 analysts covering the stock, and the mean price target of $83.35 is a premium of 7.3% to current levels.


On the date of publication, Sohini Mondal did not have (either directly or indirectly) positions in any of the securities mentioned in this article. All information and data in this article is solely for informational purposes. For more information please view the Barchart Disclosure Policy here.


More news from Barchart

Recent Quotes

View More
Symbol Price Change (%)
AMZN  207.67
-1.86 (-0.89%)
AAPL  250.12
-5.64 (-2.21%)
AMD  193.39
-4.35 (-2.20%)
BAC  46.72
-0.41 (-0.87%)
GOOG  301.46
-1.75 (-0.58%)
META  613.71
-24.47 (-3.83%)
MSFT  395.55
-6.31 (-1.57%)
NVDA  180.25
-2.89 (-1.58%)
ORCL  155.11
-4.05 (-2.54%)
TSLA  391.20
-3.81 (-0.96%)
Stock Quote API & Stock News API supplied by www.cloudquote.io
Quotes delayed at least 20 minutes.
By accessing this page, you agree to the Privacy Policy and Terms Of Service.


IntelligentValue Home
Close Window

DISCLAIMER

All content herein is issued solely for informational purposes and is not to be construed as an offer to sell or the solicitation of an offer to buy, nor should it be interpreted as a recommendation to buy, hold or sell (short or otherwise) any security.  All opinions, analyses, and information included herein are based on sources believed to be reliable, but no representation or warranty of any kind, expressed or implied, is made including but not limited to any representation or warranty concerning accuracy, completeness, correctness, timeliness or appropriateness. We undertake no obligation to update such opinions, analysis or information. You should independently verify all information contained on this website. Some information is based on analysis of past performance or hypothetical performance results, which have inherent limitations. We make no representation that any particular equity or strategy will or is likely to achieve profits or losses similar to those shown. Shareholders, employees, writers, contractors, and affiliates associated with ETFOptimize.com may have ownership positions in the securities that are mentioned. If you are not sure if ETFs, algorithmic investing, or a particular investment is right for you, you are urged to consult with a Registered Investment Advisor (RIA). Neither this website nor anyone associated with producing its content are Registered Investment Advisors, and no attempt is made herein to substitute for personalized, professional investment advice. Neither ETFOptimize.com, Global Alpha Investments, Inc., nor its employees, service providers, associates, or affiliates are responsible for any investment losses you may incur as a result of using the information provided herein. Remember that past investment returns may not be indicative of future returns.

Copyright © 1998-2017 ETFOptimize.com, a publication of Optimized Investments, Inc. All rights reserved.