ETFOptimize | High-performance ETF-based Investment Strategies

Quantitative strategies, Wall Street-caliber research, and insightful market analysis since 1998.


ETFOptimize | HOME
Close Window

Is General Mills Stock Underperforming the S&P 500?

With a market cap of $23.2 billion, General Mills, Inc. (GIS) produces and markets a wide range of branded consumer foods, including cereals, snacks, baking products, frozen meals, ice cream, and pet food through segments such as North America Retail, International, North America Pet, and North America Foodservice. 

Companies valued at $10 billion or more are generally considered "large-cap" stocks, and General Mills fits this criterion perfectly. Its products are sold worldwide through grocery stores, mass merchandisers, e-commerce retailers, restaurants, and specialty pet stores under well-known brands like Cheerios, Betty Crocker, Pillsbury, and Häagen-Dazs.


Shares of the Minneapolis, Minnesota-based company have dipped 33.1% from its 52-week high of $64.95. Shares of General Mills have declined 4.9% over the past three months, underperforming the broader S&P 500 Index’s ($SPX) marginal drop during the same period. 

www.barchart.com

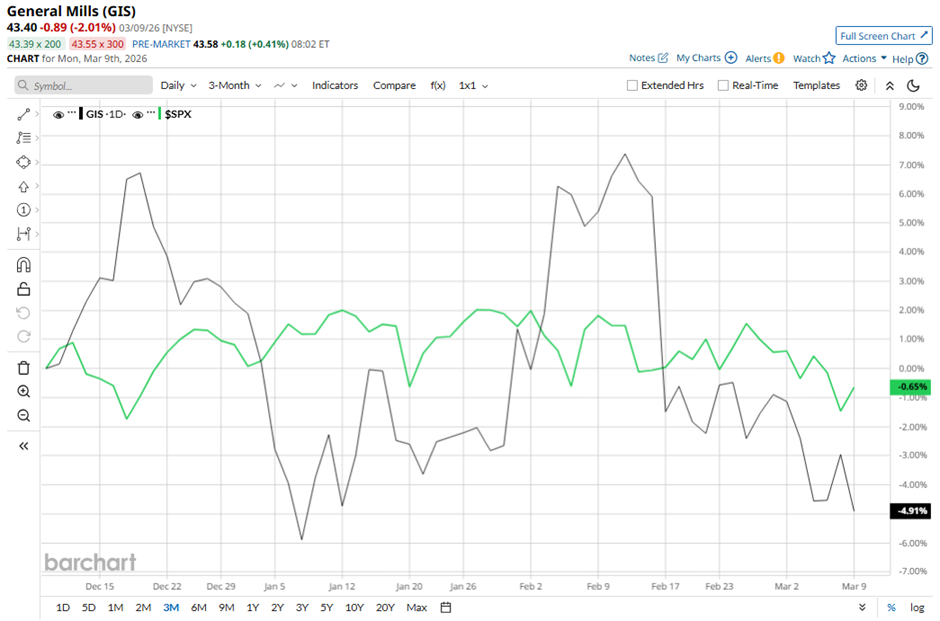
The company’s shares have decreased 6.7% on a YTD basis, lagging behind SPX's marginal decline. Longer term, GIS stock has dropped 32.7% over the past 52 weeks, compared to the 17.8% return of the SPX over the same time frame.

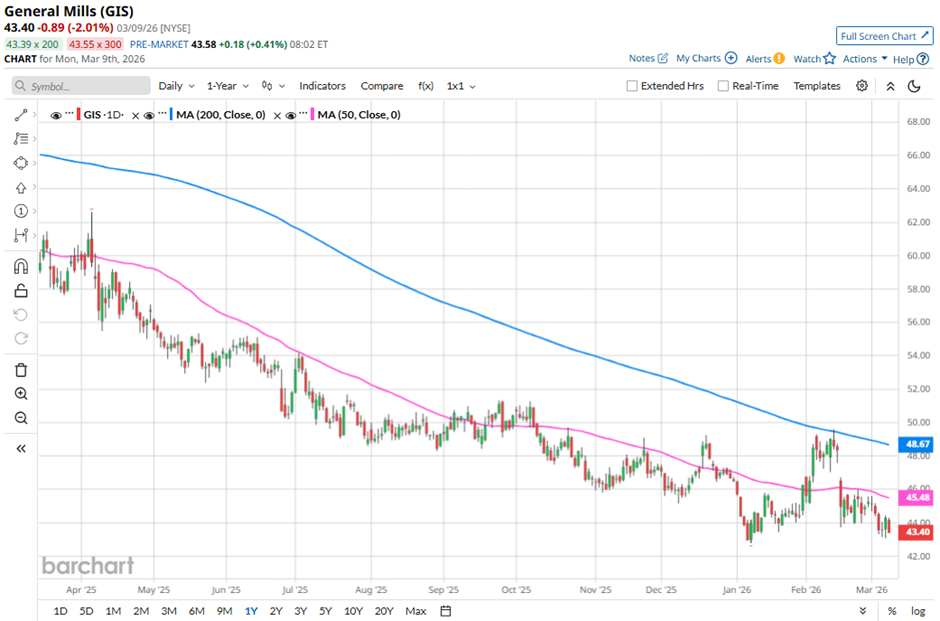
The stock has been trading below its 50-day and 200-day moving averages since last year.

www.barchart.com

Shares of General Mills rose 3.4% on Dec. 17, 2025, after the company released Q2 2026 results. The company highlighted strong growth drivers, including expectations that new product innovation will increase about 25% this year and reported market share gains in 8 of its top 10 categories, signaling improving demand. Investors were also encouraged by the Love Made Fresh pet food rollout reaching 4,658 coolers with a target of 5,000 by January and about 5% market share, along with management’s outlook for top-line improvement in the second half and profit growth in Q4.

In comparison, GIS stock has lagged behind its rival McCormick & Company, Incorporated (MKC). MKC stock has declined 5.8% on a YTD basis and 22.3% over the past 52 weeks.

Due to GIS stock’s underperformance, analysts are cautious with a consensus rating of "Hold" from 20 analysts. The mean price target of $49.53 is a premium of 14.1% to current levels.


On the date of publication, Sohini Mondal did not have (either directly or indirectly) positions in any of the securities mentioned in this article. All information and data in this article is solely for informational purposes. For more information please view the Barchart Disclosure Policy here.


More news from Barchart

Recent Quotes

View More
Symbol Price Change (%)
AMZN  207.67
-1.86 (-0.89%)
AAPL  250.12
-5.64 (-2.21%)
AMD  193.39
-4.35 (-2.20%)
BAC  46.72
-0.41 (-0.87%)
GOOG  301.46
-1.75 (-0.58%)
META  613.71
-24.47 (-3.83%)
MSFT  395.55
-6.31 (-1.57%)
NVDA  180.25
-2.89 (-1.58%)
ORCL  155.11
-4.05 (-2.54%)
TSLA  391.20
-3.81 (-0.96%)
Stock Quote API & Stock News API supplied by www.cloudquote.io
Quotes delayed at least 20 minutes.
By accessing this page, you agree to the Privacy Policy and Terms Of Service.


IntelligentValue Home
Close Window

DISCLAIMER

All content herein is issued solely for informational purposes and is not to be construed as an offer to sell or the solicitation of an offer to buy, nor should it be interpreted as a recommendation to buy, hold or sell (short or otherwise) any security.  All opinions, analyses, and information included herein are based on sources believed to be reliable, but no representation or warranty of any kind, expressed or implied, is made including but not limited to any representation or warranty concerning accuracy, completeness, correctness, timeliness or appropriateness. We undertake no obligation to update such opinions, analysis or information. You should independently verify all information contained on this website. Some information is based on analysis of past performance or hypothetical performance results, which have inherent limitations. We make no representation that any particular equity or strategy will or is likely to achieve profits or losses similar to those shown. Shareholders, employees, writers, contractors, and affiliates associated with ETFOptimize.com may have ownership positions in the securities that are mentioned. If you are not sure if ETFs, algorithmic investing, or a particular investment is right for you, you are urged to consult with a Registered Investment Advisor (RIA). Neither this website nor anyone associated with producing its content are Registered Investment Advisors, and no attempt is made herein to substitute for personalized, professional investment advice. Neither ETFOptimize.com, Global Alpha Investments, Inc., nor its employees, service providers, associates, or affiliates are responsible for any investment losses you may incur as a result of using the information provided herein. Remember that past investment returns may not be indicative of future returns.

Copyright © 1998-2017 ETFOptimize.com, a publication of Optimized Investments, Inc. All rights reserved.