ETFOptimize | High-performance ETF-based Investment Strategies

Quantitative strategies, Wall Street-caliber research, and insightful market analysis since 1998.


ETFOptimize | HOME
Close Window

Is lululemon athletica Stock Underperforming the Dow?

lululemon athletica inc. (LULU), headquartered in Vancouver, Canada, designs, distributes, and retails athletic apparel, footwear, and accessories under the lululemon brand for women and men. Valued at $19.9 billion by market cap, the company produces fitness pants, shorts, tops and jackets for yoga, dance, running, and general fitness.

Companies worth $10 billion or more are generally described as “large-cap stocks,” and LULU perfectly fits that description, with its market cap exceeding this mark, underscoring its size, influence, and dominance within the apparel retail industry. LULU's reputation for quality and innovation has built a loyal customer base, driving repeat purchases and positive word-of-mouth. Their consistent R&D investment leads to unique products that set them apart from competitors, allowing control over the customer experience and margins.


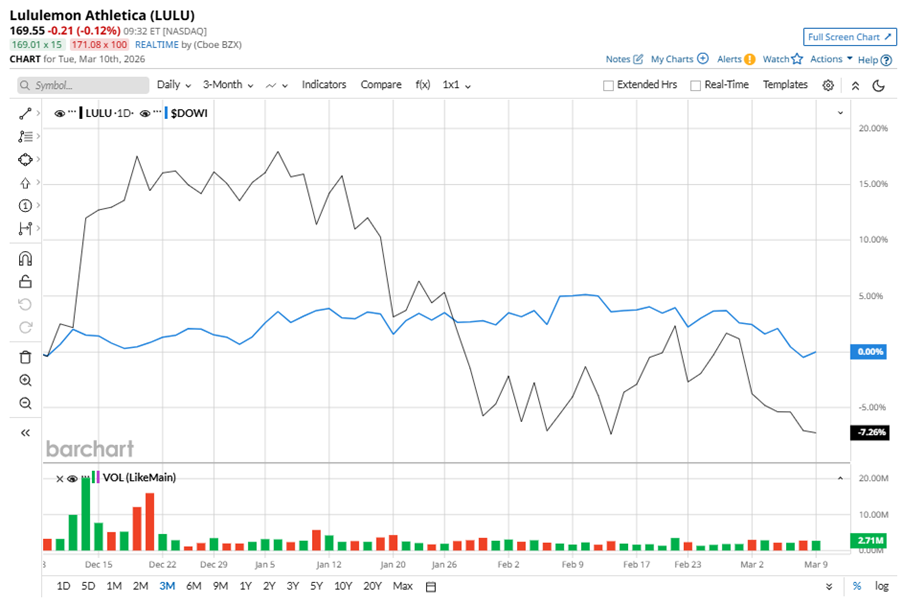
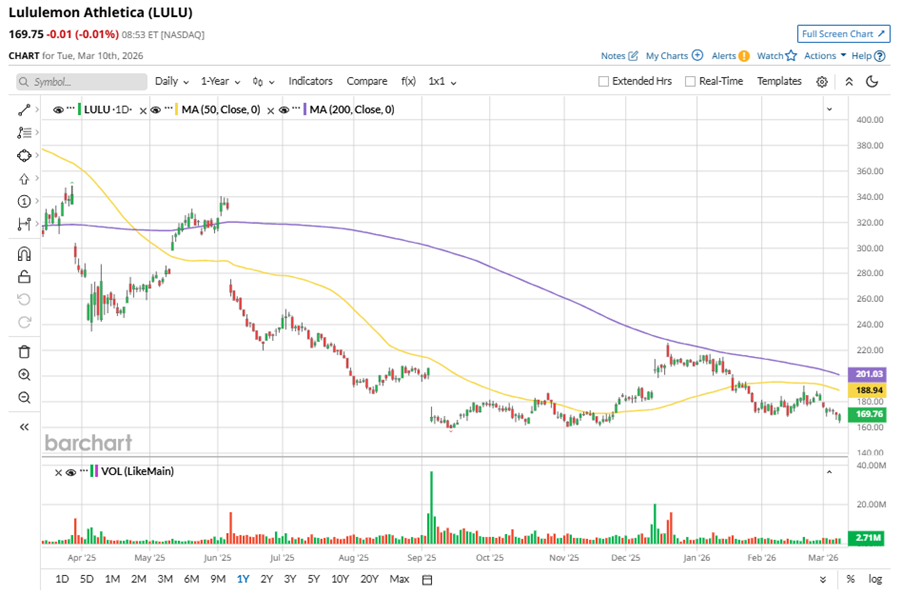
Despite its notable strength, LULU slipped 51.3% from its 52-week high of $348.50, achieved on Mar. 27, 2025. Over the past three months, LULU stock declined 9.5%, underperforming the Dow Jones Industrials Average’s ($DOWI) marginal gains during the same time frame. 

www.barchart.com

Shares of LULU plummeted 18.3% on a YTD basis and 49.1% over the past 52 weeks, considerably underperforming DOWI’s YTD marginal losses and 11.5% returns over the last year.

To confirm the bearish trend, LULU has been trading below its 50-day moving average since late January. The stock is trading below its 200-day moving average over the past year. 

www.barchart.com

On Dec. 11, 2025, LULU reported its Q3 results, and its shares closed up by 9.6% in the following trading session. Its EPS of $2.59 surpassed Wall Street expectations of $2.22. The company’s revenue was $2.6 billion, topping Wall Street forecasts of $2.5 billion. The company expects full-year EPS to be $12.92 to $13.02, and revenue ranging from $11 billion to $11.1 billion.

In the competitive arena of athleisure, adidas AG (ADDYY) has taken the lead over LULU, with a 16.5% downtick on a YTD basis and 36.5% decline over the past 52 weeks.

Wall Street analysts are cautious on LULU’s prospects. The stock has a consensus “Hold” rating from the 31 analysts covering it, and the mean price target of $209.75 suggests a 23.6% potential upside from current price levels. 


On the date of publication, Neha Panjwani did not have (either directly or indirectly) positions in any of the securities mentioned in this article. All information and data in this article is solely for informational purposes. For more information please view the Barchart Disclosure Policy here.


More news from Barchart

Recent Quotes

View More
Symbol Price Change (%)
AMZN  207.67
-1.86 (-0.89%)
AAPL  250.12
-5.64 (-2.21%)
AMD  193.39
-4.35 (-2.20%)
BAC  46.72
-0.41 (-0.87%)
GOOG  301.46
-1.75 (-0.58%)
META  613.71
-24.47 (-3.83%)
MSFT  395.55
-6.31 (-1.57%)
NVDA  180.25
-2.89 (-1.58%)
ORCL  155.11
-4.05 (-2.54%)
TSLA  391.20
-3.81 (-0.96%)
Stock Quote API & Stock News API supplied by www.cloudquote.io
Quotes delayed at least 20 minutes.
By accessing this page, you agree to the Privacy Policy and Terms Of Service.


IntelligentValue Home
Close Window

DISCLAIMER

All content herein is issued solely for informational purposes and is not to be construed as an offer to sell or the solicitation of an offer to buy, nor should it be interpreted as a recommendation to buy, hold or sell (short or otherwise) any security.  All opinions, analyses, and information included herein are based on sources believed to be reliable, but no representation or warranty of any kind, expressed or implied, is made including but not limited to any representation or warranty concerning accuracy, completeness, correctness, timeliness or appropriateness. We undertake no obligation to update such opinions, analysis or information. You should independently verify all information contained on this website. Some information is based on analysis of past performance or hypothetical performance results, which have inherent limitations. We make no representation that any particular equity or strategy will or is likely to achieve profits or losses similar to those shown. Shareholders, employees, writers, contractors, and affiliates associated with ETFOptimize.com may have ownership positions in the securities that are mentioned. If you are not sure if ETFs, algorithmic investing, or a particular investment is right for you, you are urged to consult with a Registered Investment Advisor (RIA). Neither this website nor anyone associated with producing its content are Registered Investment Advisors, and no attempt is made herein to substitute for personalized, professional investment advice. Neither ETFOptimize.com, Global Alpha Investments, Inc., nor its employees, service providers, associates, or affiliates are responsible for any investment losses you may incur as a result of using the information provided herein. Remember that past investment returns may not be indicative of future returns.

Copyright © 1998-2017 ETFOptimize.com, a publication of Optimized Investments, Inc. All rights reserved.