With a market cap of $49.8 billion, Nasdaq, Inc. (NDAQ) provides services to capital markets and other industries in the United States and internationally. The company operates through three main segments: Capital Access Platforms, Financial Technology, and Market Services, offering solutions such as market data distribution, trading platforms, and regulatory technology.
Companies valued at $10 billion or more are generally considered "large-cap" stocks, and Nasdaq fits this criterion perfectly. It also operates multiple exchanges and provides trading, clearing, and financial surveillance solutions across various asset classes.
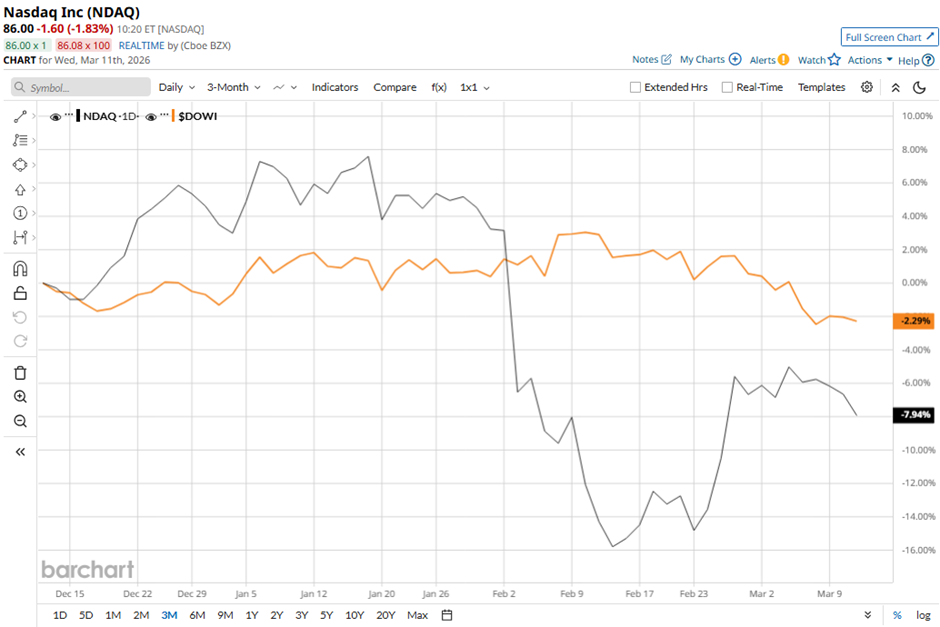
Shares of the New York-based company have declined 16.2% from its 52-week high of $101.79. Over the past three months, NDAQ stock has fallen 7.6%, underperforming the broader Dow Jones Industrials Average's ($DOWI) 2.7% drop over the same period.
Shares of Nasdaq have decreased 10.7% on a YTD basis, lagging behind DOWI's 1.4% dip. However, over the past 52 weeks, NDAQ stock has soared 19.9%, outpacing DOWI’s 14.4% return during the same period.
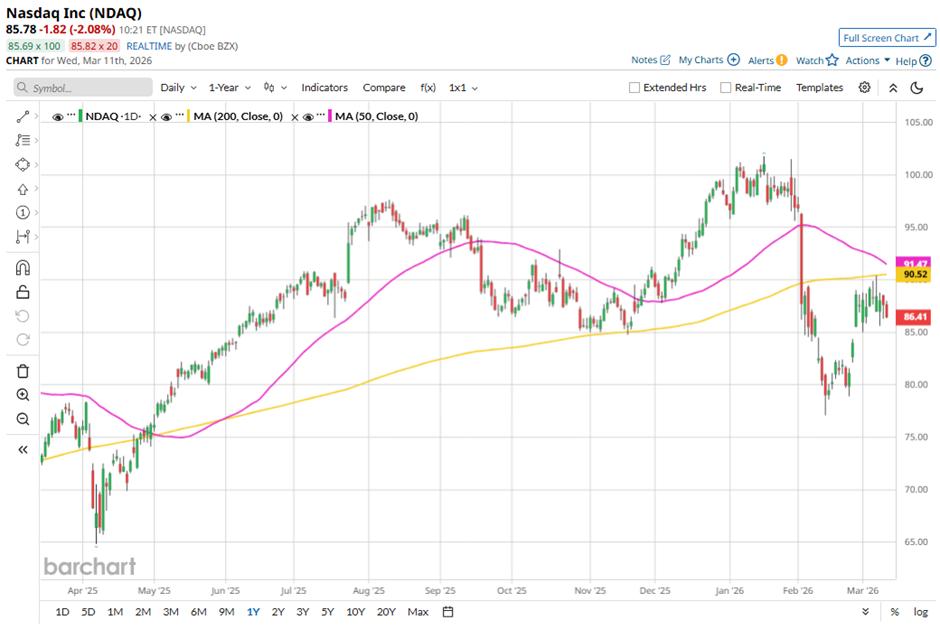
The stock has been trading below its 50-day and 200-day moving averages since February.
Nasdaq reported strong 2025 financial results on Jan. 29, including record net revenue of $5.2 billion (up 13%) and Solutions revenue of $4 billion (up 12%), marking the first time the company exceeded both milestones. The firm also posted Q4 net revenue of $1.4 billion (up 13%), Financial Technology revenue of $498 million (up 14%), and Index revenue growth of 23% to $232 million. However, the stock fell marginally on that day.
In comparison, rival MSCI Inc. (MSCI) has outpaced NDAQ stock on a YTD basis, with MSCI stock declining 4%. Nevertheless, MSCI stock has gained 1.6% over the past 52 weeks, lagging behind NDAQ stock.
Due to NDAQ's stock outperformance over the past year, analysts are bullish about its prospects. The stock carries a consensus “Strong Buy” rating from 18 analysts, and the mean price target of $112.06 suggests a premium of 30.6% to current levels.
On the date of publication, Sohini Mondal did not have (either directly or indirectly) positions in any of the securities mentioned in this article. All information and data in this article is solely for informational purposes. For more information please view the Barchart Disclosure Policy here.
More news from Barchart
- Applied Materials and Micron Are Partnering on Memory. Is AMAT or MU Stock a Better Buy Here?
- Should You Buy Vertiv Stock Before March 23?
- Former Starbucks CEO Howard Schultz Announces Move to Miami Same Day as Washington Passes New Millionaires Tax
- 3 Top-Rated Stocks to Buy to Hedge Against Stagflation as Middle East Conflict Drags On


