Headquartered in Goleta, California, Deckers Outdoor Corporation (DECK) is a global lifestyle brand owner that designs and markets footwear, apparel, and accessories for both everyday wear and performance-driven activities. Its brand portfolio carries strong consumer recognition and includes UGG, HOKA, Teva, Koolaburra, and AHNU.
With a market cap of nearly $14.9 billion, the company occupies the “large-cap” territory, a league reserved for businesses valued above $10 billion. The scale allows Deckers to distribute its products worldwide through a balanced network that includes retail partners, third-party distributors, company-operated stores, and fast-growing e-commerce channels.
The stock is currently trading approximately 23% below its 52-week high of $133.43 reached in May 2025. In the near term, however, the picture shows a different shade of momentum. Shares have climbed 1.3% over the past three months while the Nasdaq Composite ($NASX) declined 3.7% during the same stretch.
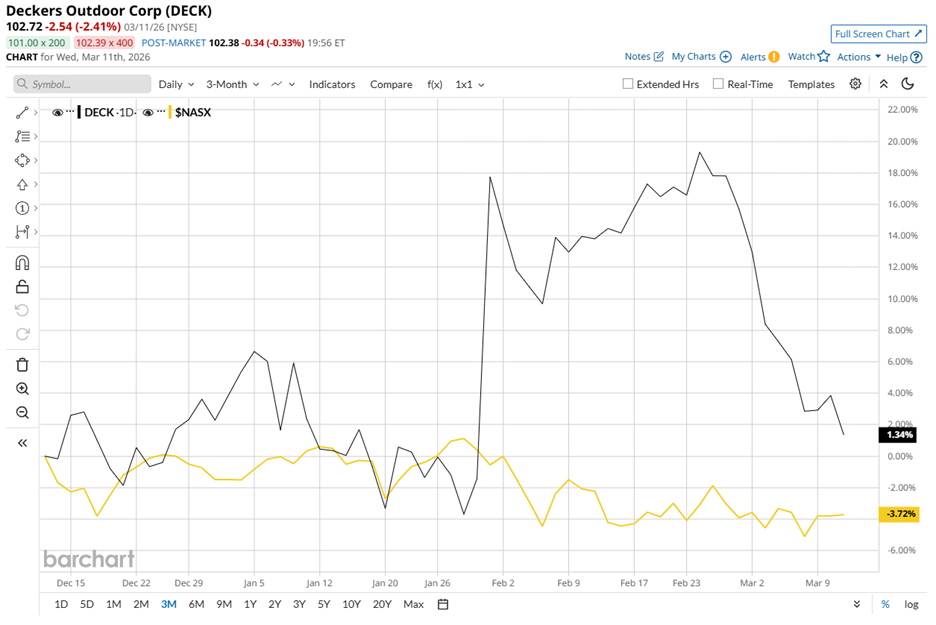
Zooming out reveals a tougher longer-term trend. Over the past 52 weeks, the stock has fallen 14.8%, trailing the Nasdaq’s robust 30.3% gain. So far in 2026, the gap has narrowed, with Deckers only marginally down year-to-date (YTD), while the index plunged about 2.3%.
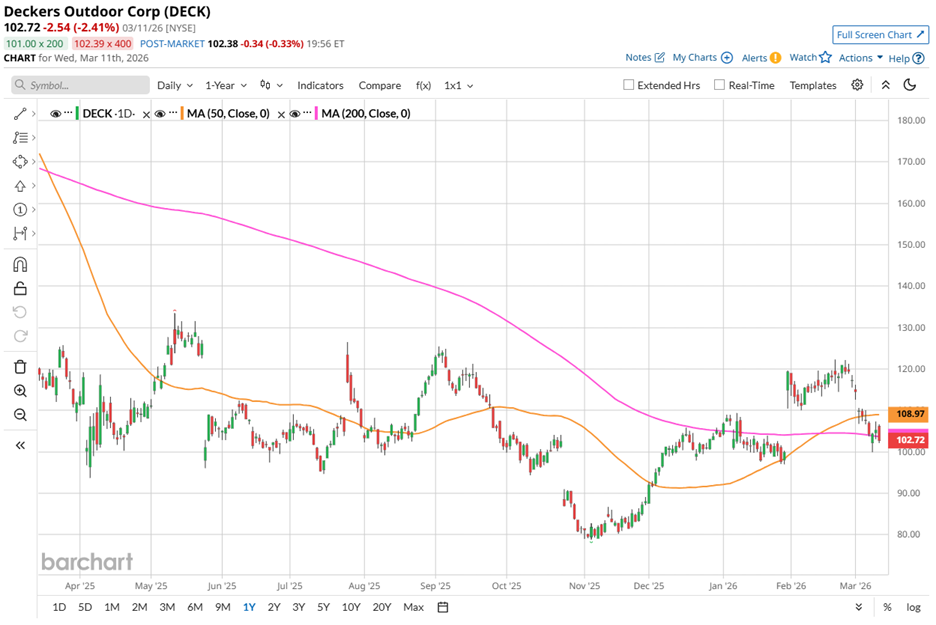
Technical signals echo the cooling momentum. The stock briefly traded above both its 50-day and 200-day moving averages in February. However, the rally proved short-lived. Shares now trade below the 50-day moving average of $108.97 and the 200-day moving average of $103.68.
Operational performance, however, continues to tell a more encouraging story. On Jan. 29, the company released its Q3 fiscal 2026 financial results, wherein revenue increased 7.1% year over year to $1.96 billion, surpassing analyst expectations of $1.87 billion. Meanwhile, EPS climbed 11% to $3.33 from the year-ago level and cleared Wall Street’s estimate of $2.76.
The market welcomed the earnings beat with a strong reaction. Shares gained 2.3% on the day of the announcement and then surged another 19.5% in the following trading session, signaling that the company’s brand engine still fires on all cylinders.
Management’s forward outlook reinforces the optimism. For the full fiscal year 2026, they expect net sales to land between $5.400 billion and $5.425 billion. Diluted EPS is estimated to reach a range of $6.80 to $6.85, suggesting steady operational strength even as the stock navigates volatility.
Relative performance adds another layer to the picture. Deckers’ rival, Crocs, Inc. (CROX) has struggled even more sharply, with its shares plunging 18.2% over the past 52 weeks and declining 6% YTD. Against that backdrop, Deckers’ pullback appears less like a structural breakdown and more like a period of consolidation after a strong run.
Wall Street largely shares the measured optimism. Among 26 analysts covering the stock, the overall rating stands at “Moderate Buy.” Its average price target of $127.16 signals 23.8% upside potential from current levels, suggesting analysts view the recent weakness as a temporary detour rather than a lasting shift in the company’s trajectory.
On the date of publication, Aanchal Sugandh did not have (either directly or indirectly) positions in any of the securities mentioned in this article. All information and data in this article is solely for informational purposes. For more information please view the Barchart Disclosure Policy here.
More news from Barchart
- This Dividend Stock Yielding Almost 3% Is Outperforming In 2026: Should You Buy?
- Dear Lumentum Stock Fans, Mark Your Calendars for March 23
- Should Risk-Takers Roll the Dice on These 3 Penny Stocks at 52-Week Lows?
- As Archer Aviation Joins a DoT Pilot Program, Should You Buy, Sell, or Hold ACHR Stock?


