ETFOptimize | High-performance ETF-based Investment Strategies

Quantitative strategies, Wall Street-caliber research, and insightful market analysis since 1998.


ETFOptimize | HOME
Close Window

Is ON Semiconductor Stock Outperforming the Dow?

Valued at a market cap of $23.3 billion, ON Semiconductor Corporation (ON) is a Scottsdale, Arizona-based company that provides intelligent sensing and power solutions, including power management chips, analog and mixed-signal integrated circuits, image sensors, and discrete semiconductor devices. 

Companies worth $10 billion or more are typically classified as “large-cap stocks,” and ON fits the label perfectly, with its market cap exceeding this threshold, underscoring its size, influence, and dominance within the semiconductor industry. The company’s core strengths lie in its vertical integration of Silicon Carbide (SiC) and its dominant global position in automotive image sensors for ADAS.


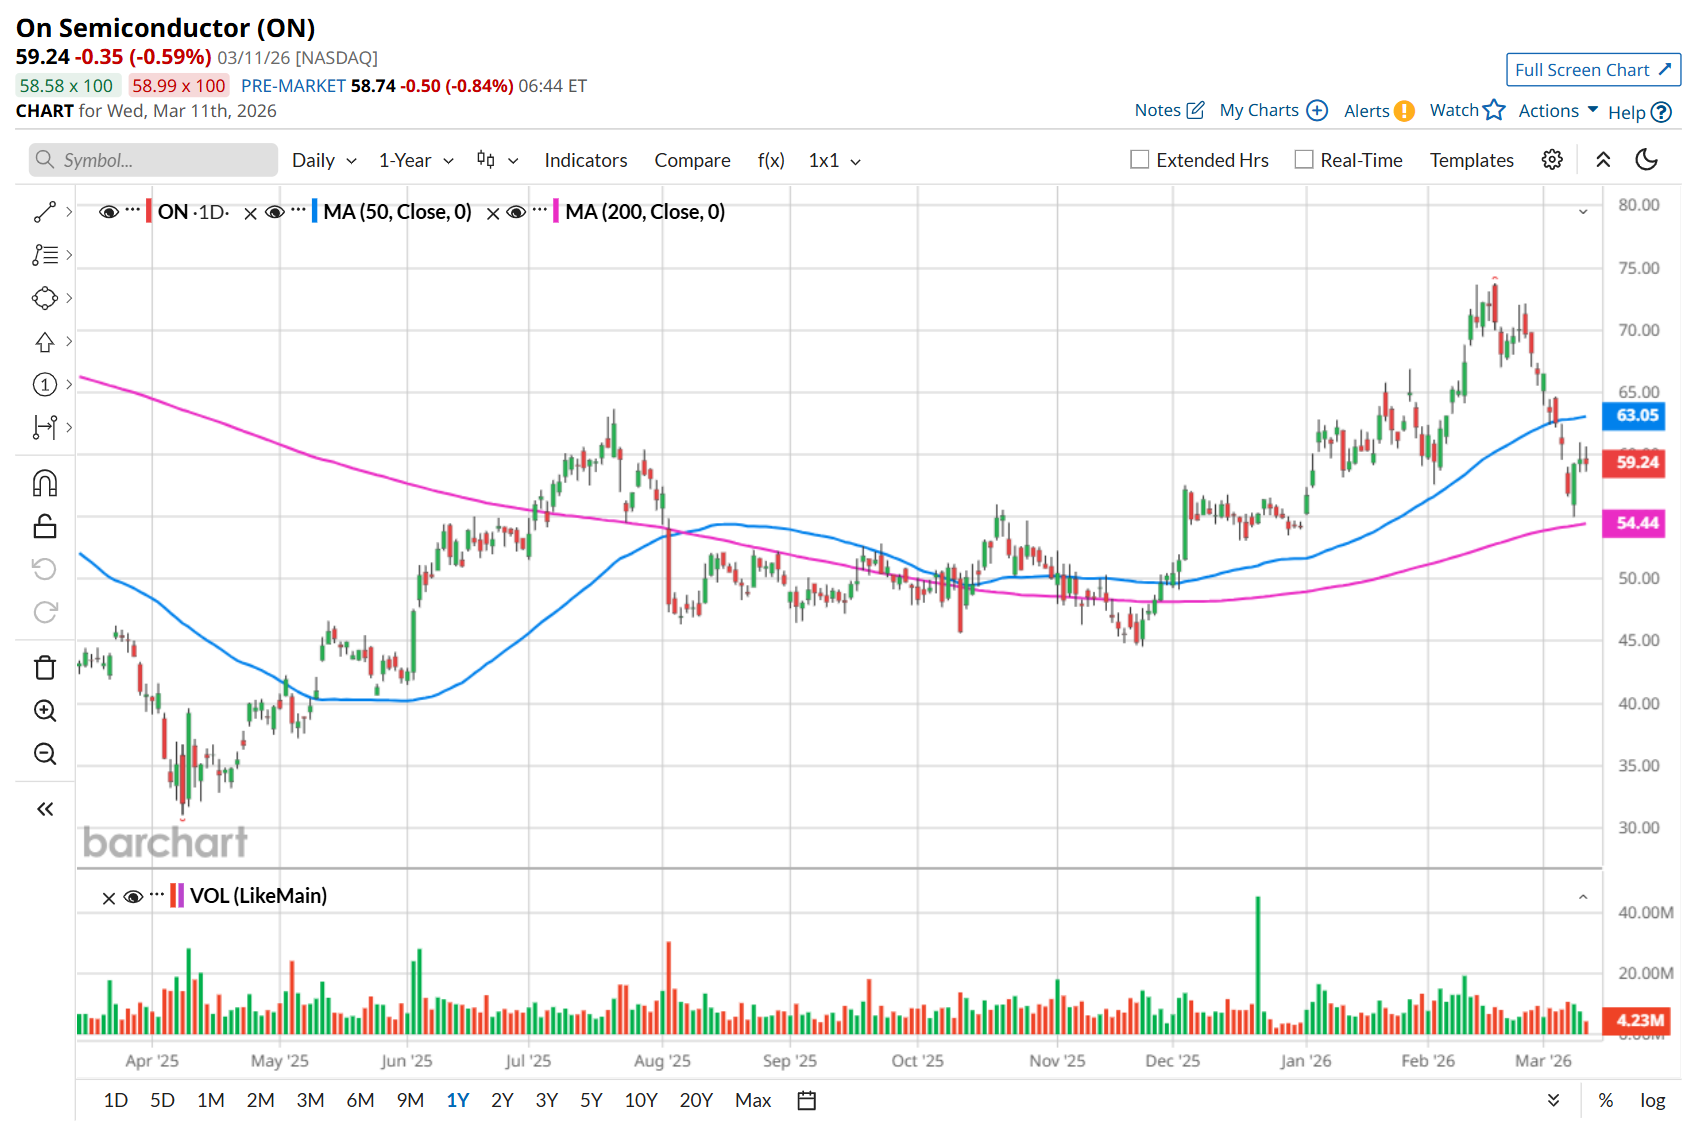
This semiconductor company is currently trading 19.7% below its 52-week high of $73.76, reached on Feb. 18. Shares of ON have gained 5.8% over the past three months, outperforming the Dow Jones Industrial Average’s ($DOWI2.6% drop during the same time frame.

www.barchart.com

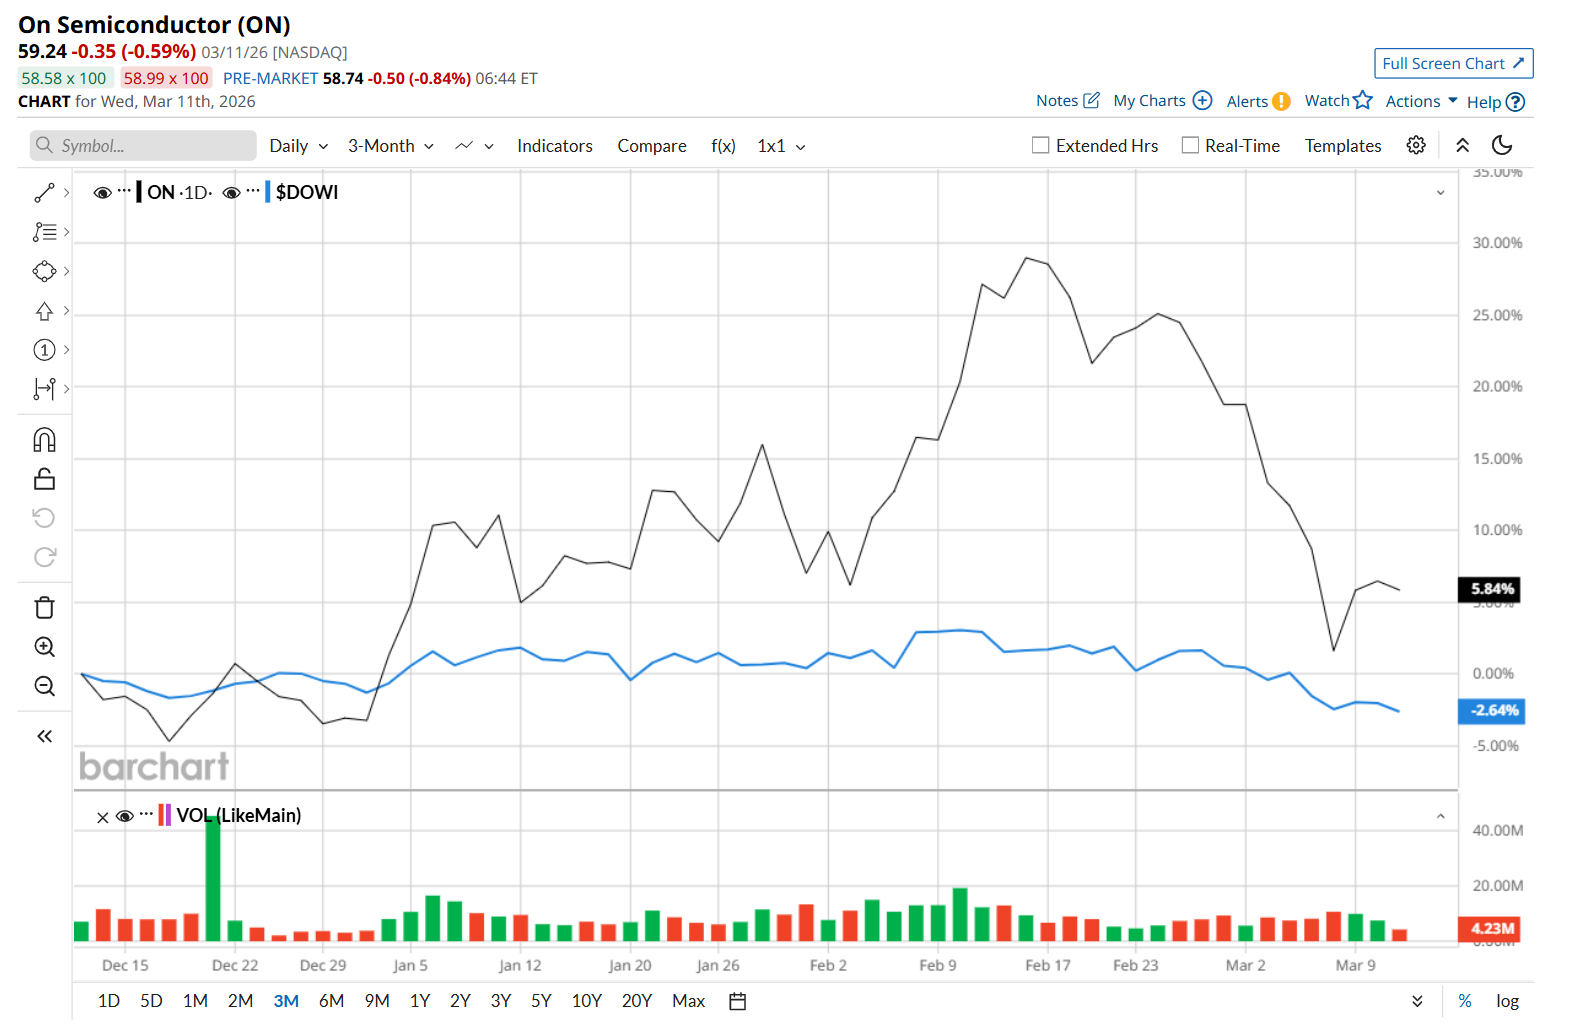
 Moreover, on a YTD basis, shares of ON are up 9.4%, compared to DOWI’s 1.3% fall. In the longer term, ON has rallied 38.2% over the past 52 weeks, considerably outpacing DOWI’s 14.4% uptick over the same time frame. 

To confirm its bullish trend, ON has been trading above its 200-day moving average since late November. However, it has started trading below its 50-day moving average since early March. 

www.barchart.com

On Feb. 10, shares of ON rose 3.5% following the company’s fourth-quarter earnings release. The analog chip manufacturer reported adjusted EPS of $0.64, slightly surpassing analysts’ expectations of $0.62. Revenue totaled $1.5 billion, meeting market forecasts but marking an 11.2% decline compared to the same period last year. Despite the year-over-year revenue drop, investors responded positively to the earnings beat and the company’s strong free cash flow margin of 31.7% during the quarter.

ON has outperformed its rival, Texas Instruments Incorporated (TXN), which gained 12% over the past 52 weeks. However, it has lagged TXN’s 14.5% YTD rise. 

Looking at ON’s recent outperformance, analysts remain moderately optimistic about its prospects. The stock has a consensus rating of "Moderate Buy” from the 33 analysts covering it, and the mean price target of $68.03 suggests a 14.8% premium to its current price levels. 


On the date of publication, Neharika Jain did not have (either directly or indirectly) positions in any of the securities mentioned in this article. All information and data in this article is solely for informational purposes. For more information please view the Barchart Disclosure Policy here.


More news from Barchart

Recent Quotes

View More
Symbol Price Change (%)
AMZN  207.67
-1.86 (-0.89%)
AAPL  250.12
-5.64 (-2.21%)
AMD  193.39
-4.35 (-2.20%)
BAC  46.72
-0.41 (-0.87%)
GOOG  301.46
-1.75 (-0.58%)
META  613.71
-24.47 (-3.83%)
MSFT  395.55
-6.31 (-1.57%)
NVDA  180.25
-2.89 (-1.58%)
ORCL  155.11
-4.05 (-2.54%)
TSLA  391.20
-3.81 (-0.96%)
Stock Quote API & Stock News API supplied by www.cloudquote.io
Quotes delayed at least 20 minutes.
By accessing this page, you agree to the Privacy Policy and Terms Of Service.


IntelligentValue Home
Close Window

DISCLAIMER

All content herein is issued solely for informational purposes and is not to be construed as an offer to sell or the solicitation of an offer to buy, nor should it be interpreted as a recommendation to buy, hold or sell (short or otherwise) any security.  All opinions, analyses, and information included herein are based on sources believed to be reliable, but no representation or warranty of any kind, expressed or implied, is made including but not limited to any representation or warranty concerning accuracy, completeness, correctness, timeliness or appropriateness. We undertake no obligation to update such opinions, analysis or information. You should independently verify all information contained on this website. Some information is based on analysis of past performance or hypothetical performance results, which have inherent limitations. We make no representation that any particular equity or strategy will or is likely to achieve profits or losses similar to those shown. Shareholders, employees, writers, contractors, and affiliates associated with ETFOptimize.com may have ownership positions in the securities that are mentioned. If you are not sure if ETFs, algorithmic investing, or a particular investment is right for you, you are urged to consult with a Registered Investment Advisor (RIA). Neither this website nor anyone associated with producing its content are Registered Investment Advisors, and no attempt is made herein to substitute for personalized, professional investment advice. Neither ETFOptimize.com, Global Alpha Investments, Inc., nor its employees, service providers, associates, or affiliates are responsible for any investment losses you may incur as a result of using the information provided herein. Remember that past investment returns may not be indicative of future returns.

Copyright © 1998-2017 ETFOptimize.com, a publication of Optimized Investments, Inc. All rights reserved.