ResMed Inc. (RMD), headquartered in San Diego, California, manufactures, distributes, and markets medical devices and cloud-based software applications. Valued at $36 billion by market cap, the company offers a range of products for respiratory disorders, including diagnostic tools like ApneaLink Air and NightOwl, cloud-based platforms like AirView and myAir for patient monitoring, and U-Sleep for HME providers, connectivity solutions, as well as out-of-hospital software solutions.
Companies worth $10 billion or more are generally described as “large-cap stocks,” and RMD perfectly fits that description, with its market cap exceeding this mark, underscoring its size, influence, and dominance within the medical instruments & supplies industry. ResMed's competitive edge stems from its diversified sleep and respiratory care portfolio, strong brand, and innovation in tech like AI-powered therapy and remote monitoring. With a global presence in 140+ countries, ResMed leverages its strengths to stay ahead.
Despite its notable strength, RMD slipped 18.3% from its 52-week high of $293.81, achieved on Aug. 22, 2025. Over the past three months, RMD stock has declined 4.9%, underperforming the Nasdaq Composite’s ($NASX) 3.7% losses during the same time frame.
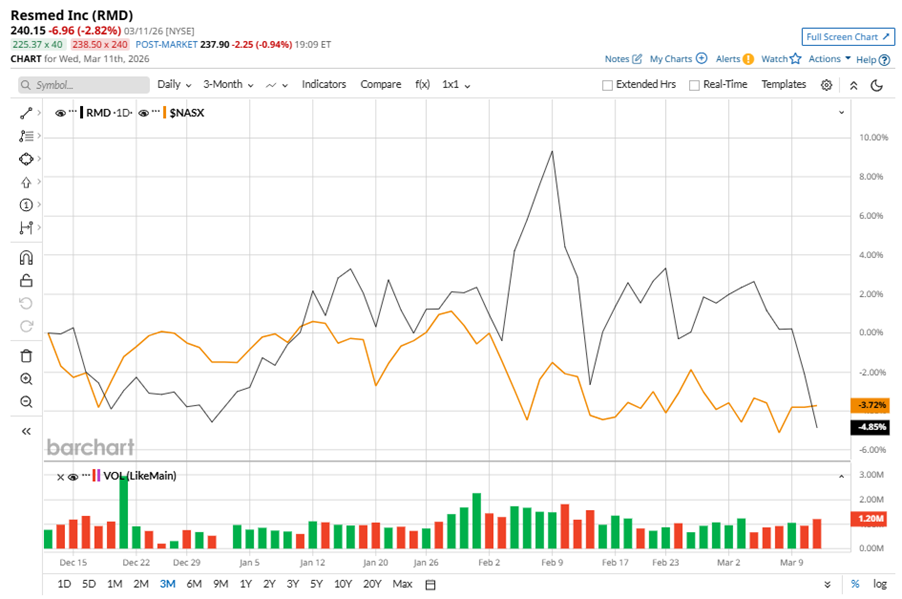
Shares of RMD fell marginally on a YTD basis, outperforming NASX’s YTD losses of 2.3%. However, in the longer term, the stock climbed 6.4% over the past 52 weeks, underperforming NASX’s 30.3% returns over the last year.
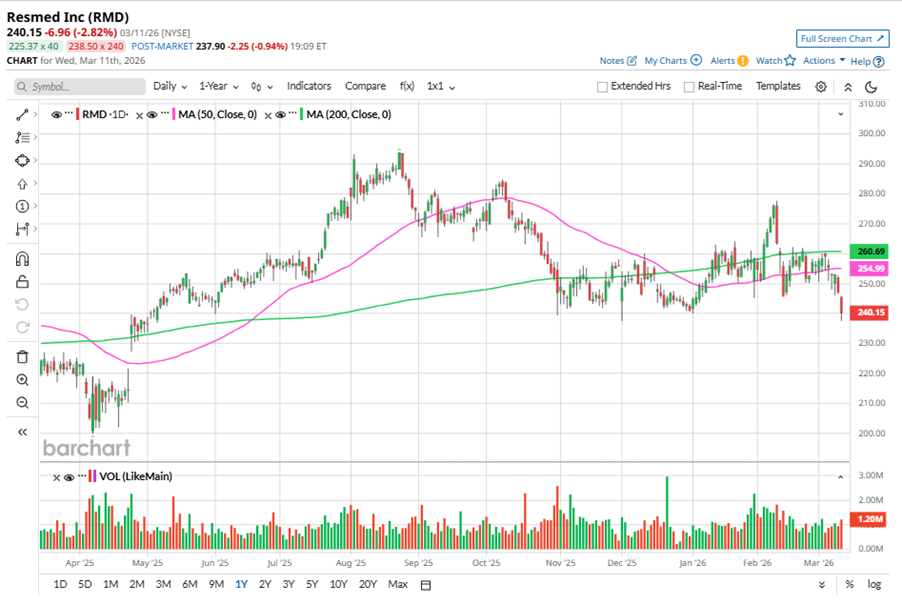
To confirm the bearish trend, RMD has been trading below its 200-day moving average since late October, 2025, with some fluctuations. The stock is trading below its 50-day moving average recently.
On Jan. 29, RMD shares closed down slightly after reporting its Q2 results. Its adjusted EPS of $2.81 topped Wall Street expectations of $2.69. The company’s revenue was $1.42 billion, beating Wall Street forecasts of $1.39 billion.
In the competitive arena of medical instruments & supplies, Baxter International Inc. (BAX) has lagged behind RMD, with a 5.6% downtick on a YTD basis and 49.7% losses over the past 52 weeks.
Wall Street analysts are reasonably bullish on RMD’s prospects. The stock has a consensus “Moderate Buy” rating from the 19 analysts covering it, and the mean price target of $295.92 suggests a potential upside of 23.2% from current price levels.
On the date of publication, Neha Panjwani did not have (either directly or indirectly) positions in any of the securities mentioned in this article. All information and data in this article is solely for informational purposes. For more information please view the Barchart Disclosure Policy here.
More news from Barchart
- 1 Trump-Linked Drone Stock to Buy Now Amid Middle East Conflict
- The Best Covered Call Strategy to Trade High-Yielding Pfizer Stock and Earn Extra Income
- Stocks Slip Before the Open as Middle East Conflict Lifts Oil, U.S. Economic Data on Tap
- This Dividend Stock Yielding Almost 3% Is Outperforming In 2026: Should You Buy?


