Dover Corporation (DOV), headquartered in Downers Grove, Illinois, produces a wide range of specialized industrial products and manufacturing equipment. Valued at $27.5 billion by market cap, the company provides equipment and components, consumable supplies, aftermarket parts, software and digital solutions, and support services worldwide.
Companies worth $10 billion or more are generally described as “large-cap stocks,” and DOV perfectly fits that description, with its market cap exceeding this mark, underscoring its size, influence, and dominance within the specialty industrial machinery industry. DOV's diversified portfolio and market leadership in niche industrial markets drive growth. Its innovation and tech investments boost customer loyalty and efficiency.
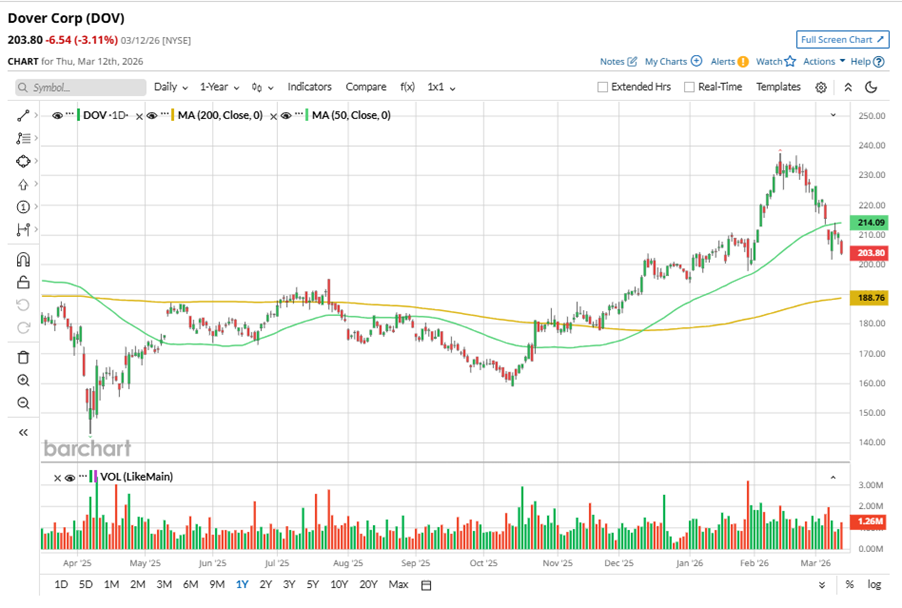
Despite its notable strength, DOV slipped 14.2% from its 52-week high of $237.54, achieved on Feb. 12. Over the past three months, DOV stock gained 2.4%, outperforming the S&P 500 Index’s ($SPX) 2.3% decline during the same time frame.
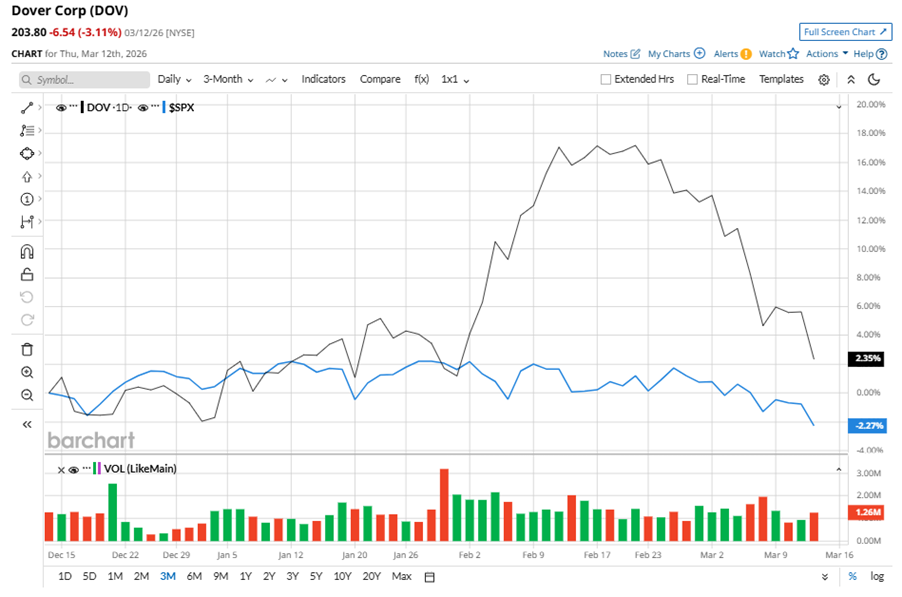
Shares of DOV rose 4.4% on a YTD basis, outperforming SPX’s YTD 2.5% loss. However, in the longer term, the stock climbed 12.1% over the past 52 weeks, underperforming SPX’s 19.2% returns over the last year.
To confirm the bullish trend, DOV is trading above its 200-day moving average since early November, 2025. However, the stock has been trading below its 50-day moving average recently.
On Jan. 29, DOV shares closed down by 1.7% after reporting its Q4 results. Its revenue was $2.10 billion, surpassing analyst estimates of $2.08 billion. The adjusted EPS of $2.51 beat analyst estimates of $2.49.
In the competitive arena of specialty industrial machinery, Illinois Tool Works Inc. (ITW) has lagged behind DOV, with a 5.7% uptick over the past 52 weeks, but outpaced the stock with 7.8% gains on a YTD basis.
Wall Street analysts are reasonably bullish on DOV’s prospects. The stock has a consensus “Moderate Buy” rating from the 18 analysts covering it, and the mean price target of $228.82 suggests a 12.3% potential upside from current price levels.
On the date of publication, Neha Panjwani did not have (either directly or indirectly) positions in any of the securities mentioned in this article. All information and data in this article is solely for informational purposes. For more information please view the Barchart Disclosure Policy here.
More news from Barchart
- Should You Buy Coherent Stock Before It Joins the S&P 500 on March 23?
- JPMorgan Says Sell This Flying Car Stock. Cathie Wood Keeps Buying. Who’s Right?
- Tesla Turns into A ‘Software-Killer’ With Macrohard: Is the Stock a Buy Now?
- 309% Gain in One Year: Can This Under-$20 Semiconductor Stock Keep Soaring in 2026?


