With a market cap of $48.5 billion, Keysight Technologies, Inc. (KEYS) is a global provider of electronic design and test solutions used across industries such as wireless communications, data centers, aerospace, defense, automotive, energy, and semiconductors. It delivers software, instrumentation, systems, and services that help organizations design, simulate, validate, manufacture, and optimize electronic and communication systems.
Companies valued at $10 billion or more are generally considered "large-cap" stocks, and Keysight Technologies fits this criterion perfectly. Headquartered in Santa Rosa, California, it also offers technical support, consulting, calibration, and managed services to enhance the performance and integration of its technologies.
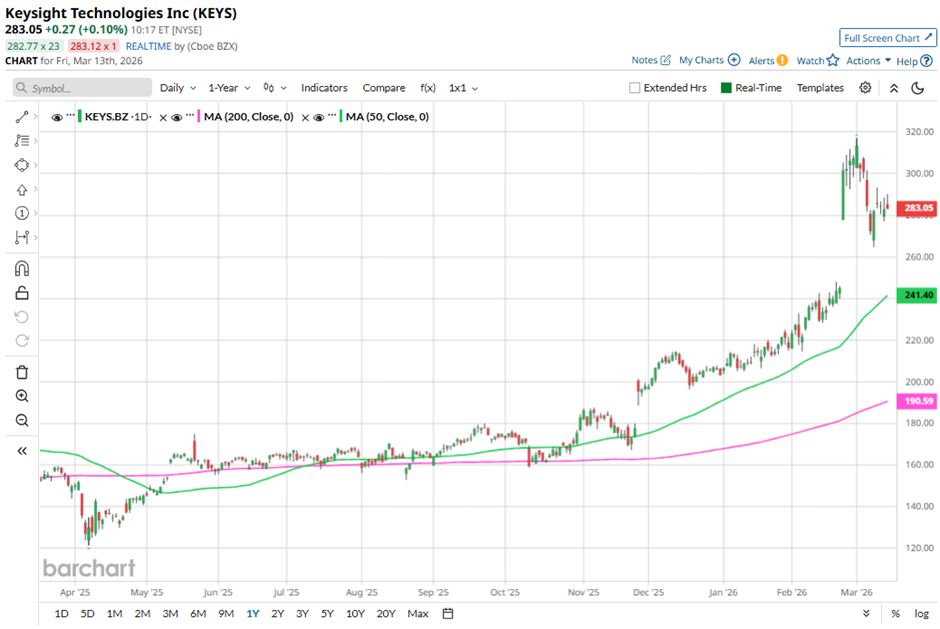
Shares of the electronic measurement provider have pulled back 10.9% from its 52-week high of $317. KEYS stock has surged 38.8% over the past three months, exceeding the broader State Street Technology Select Sector SPDR ETF's (XLK) nearly 3% decline.
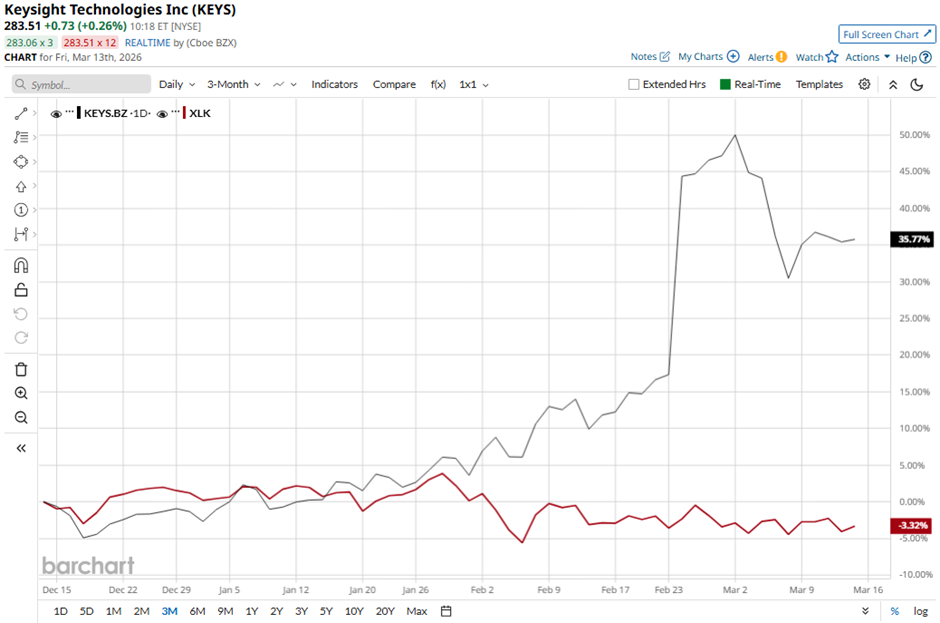
KEYS stock has climbed 42.7% on a YTD basis, surpassing XLK's 3.1% decrease. Longer term, shares of Keysight Technologies have jumped 95.7% over the past 52 weeks, compared to XLK’s 34.3% gain during that period.
The stock has maintained its position above its 50-day and 200 moving averages since May 2025.
Shares of Keysight Technologies surged 23.1% following its Q1 2026 results on Feb. 23 as the company reported record revenue of $1.60 billion, significantly higher than $1.30 billion a year earlier, along with EPS of $1.63 compared with $0.97 last year. Growth was driven by strong segment performance, particularly the Communications Solutions Group, whose revenue rose 27% to $1.12 billion with 33% growth in commercial communications, while the Electronic Industrial Solutions Group increased 15% to $476 million.
Investor sentiment was further boosted by Q2 2026 revenue guidance of $1.69 billion - $1.71 billion and adjusted EPS of $2.27 - $2.33, implying roughly 30% year-over-year growth.
In comparison, rival Coherent Corp. (COHR) has lagged behind KEYS stock on a YTD basis, with COHR stock gaining 35%. However, COHR stock has climbed 299.2% over the past 52 weeks, outpacing KEYS stock.
Due to KEYS' strong performance relative to the sector, analysts are strongly optimistic about its prospects. The stock has a consensus “Strong Buy” rating overall from the 13 analysts covering the stock, and the mean price target of $296.83 suggests a premium of 4.9% to current levels.
On the date of publication, Sohini Mondal did not have (either directly or indirectly) positions in any of the securities mentioned in this article. All information and data in this article is solely for informational purposes. For more information please view the Barchart Disclosure Policy here.
More news from Barchart