ETFOptimize | High-performance ETF-based Investment Strategies

Quantitative strategies, Wall Street-caliber research, and insightful market analysis since 1998.


ETFOptimize | HOME
Close Window

Is Ball Corporation Stock Underperforming the Nasdaq?

With a market cap of $16.5 billion, Ball Corporation (BALL) is a global manufacturer of aluminum packaging products serving the beverage, personal care, and household product industries. The company produces aluminum beverage containers used for carbonated soft drinks, beer, energy drinks, and other beverages. 

Companies valued at $10 billion or more are generally considered “large-cap” stocks, and Ball Corporation fits this criterion perfectly. It also manufactures extruded aluminum aerosol containers, reclosable aluminum bottles, aluminum cups, and aluminum slugs for various industrial and consumer applications.


Shares of the Westminster, Colorado-based company have fallen 8.9% from its 52-week high of $68.29. BALL stock has soared 22.2% over the past three months, outpacing the broader Nasdaq Composite's ($NASX) 4.7% decline over the same time frame.

www.barchart.com

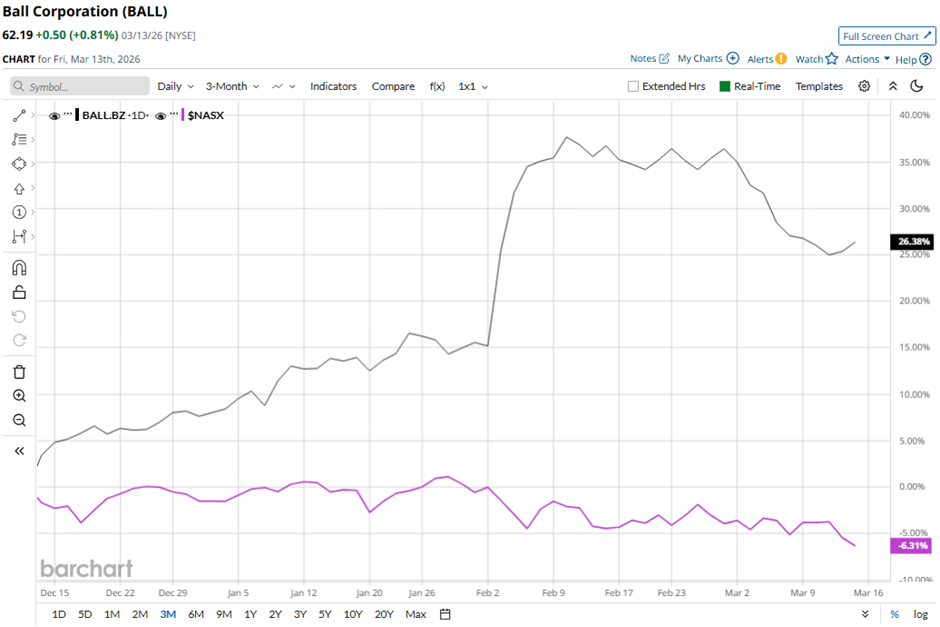
BALL stock is up 17.4% on a YTD basis, exceeding NASX's 4.9% decrease. However, shares of the aluminum packaging maker have increased 22% over the past 52 weeks, lagging behind NASX's 27.8% gain over the same time frame.

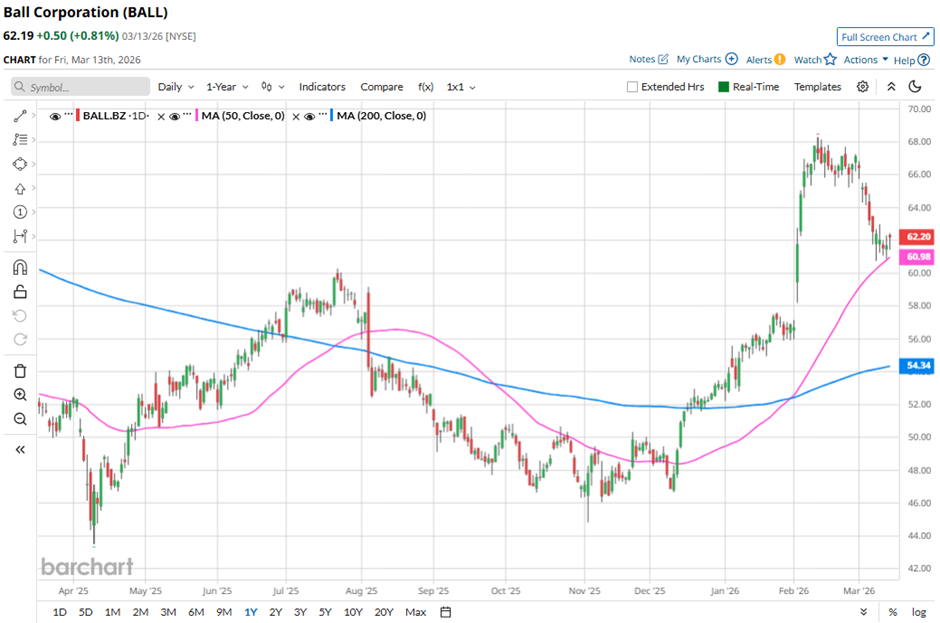
The stock has been trading above its 50-day moving average since late November 2025. Also, it has moved above its 200-day moving average since mid-December 2025.

www.barchart.com

Shares of Ball Corporation climbed nearly 9% on Feb. 3 after the company reported Q4 2025 results that exceeded Wall Street expectations. Adjusted EPS came in at $0.91 and revenue reached $3.35 billion, both surpassing analysts’ forecasts due to stronger global aluminum packaging volumes and favorable pricing. The company also reported net income of $200 million ($0.75 per share) compared with a $32 million loss a year earlier, and highlighted strong growth with Q4 shipment volumes up 6% and 2026 EPS expected to grow 10%+.

In comparison, rival International Paper Company (IP) has lagged behind BALL stock. Shares of International Paper have dipped 26.1% over the past 52 weeks and 5.4% on a YTD basis.

Despite Ball Corporation’s underperformance relative to the Nasdaq over the past year, analysts remain moderately optimistic about its prospects. Among the 15 analysts covering the stock, there is a consensus rating of “Moderate Buy,” and the mean price target of $70.75 suggests a premium of 13.8% to its current levels. 


On the date of publication, Sohini Mondal did not have (either directly or indirectly) positions in any of the securities mentioned in this article. All information and data in this article is solely for informational purposes. For more information please view the Barchart Disclosure Policy here.

Recent Quotes

View More
Symbol Price Change (%)
AMZN  209.87
+0.00 (0.00%)
AAPL  249.94
+0.00 (0.00%)
AMD  199.46
+0.00 (0.00%)
BAC  46.83
+0.00 (0.00%)
GOOG  306.30
+0.00 (0.00%)
META  615.68
+0.00 (0.00%)
MSFT  391.79
+0.00 (0.00%)
NVDA  180.40
+0.00 (0.00%)
ORCL  152.90
+0.00 (0.00%)
TSLA  392.78
+0.00 (0.00%)
Stock Quote API & Stock News API supplied by www.cloudquote.io
Quotes delayed at least 20 minutes.
By accessing this page, you agree to the Privacy Policy and Terms Of Service.


IntelligentValue Home
Close Window

DISCLAIMER

All content herein is issued solely for informational purposes and is not to be construed as an offer to sell or the solicitation of an offer to buy, nor should it be interpreted as a recommendation to buy, hold or sell (short or otherwise) any security.  All opinions, analyses, and information included herein are based on sources believed to be reliable, but no representation or warranty of any kind, expressed or implied, is made including but not limited to any representation or warranty concerning accuracy, completeness, correctness, timeliness or appropriateness. We undertake no obligation to update such opinions, analysis or information. You should independently verify all information contained on this website. Some information is based on analysis of past performance or hypothetical performance results, which have inherent limitations. We make no representation that any particular equity or strategy will or is likely to achieve profits or losses similar to those shown. Shareholders, employees, writers, contractors, and affiliates associated with ETFOptimize.com may have ownership positions in the securities that are mentioned. If you are not sure if ETFs, algorithmic investing, or a particular investment is right for you, you are urged to consult with a Registered Investment Advisor (RIA). Neither this website nor anyone associated with producing its content are Registered Investment Advisors, and no attempt is made herein to substitute for personalized, professional investment advice. Neither ETFOptimize.com, Global Alpha Investments, Inc., nor its employees, service providers, associates, or affiliates are responsible for any investment losses you may incur as a result of using the information provided herein. Remember that past investment returns may not be indicative of future returns.

Copyright © 1998-2017 ETFOptimize.com, a publication of Optimized Investments, Inc. All rights reserved.