The Spring, Texas-based Hewlett Packard Enterprise Company (HPE) delivers enterprise technology solutions spanning servers, hybrid cloud platforms, networking infrastructure, and information technology (IT) financing. It designs infrastructure, software, and services that support organizations in storing, processing, and managing data across data centers, edge environments, and cloud ecosystems.
With a market cap of roughly $28.7 billion, Hewlett-Packard sits in the “large-cap” territory, a bracket reserved for companies valued above $10 billion. The scale gives the company the reach and operational depth to serve enterprise and public-sector customers worldwide through an extensive partner channel network.
HPE stock currently trades 18.4% below its 52-week high of $26.44 reached in October 2025. Over the past three months, the shares have fallen 9.6%. Over the same stretch, the Dow Jones Industrial Average ($DOWI) has declined a milder 3.9%.
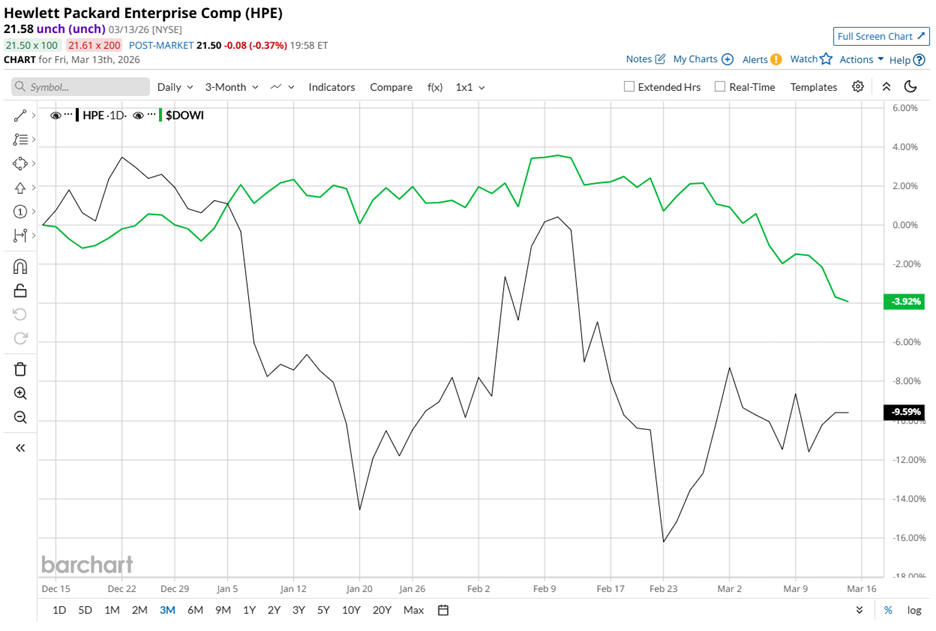
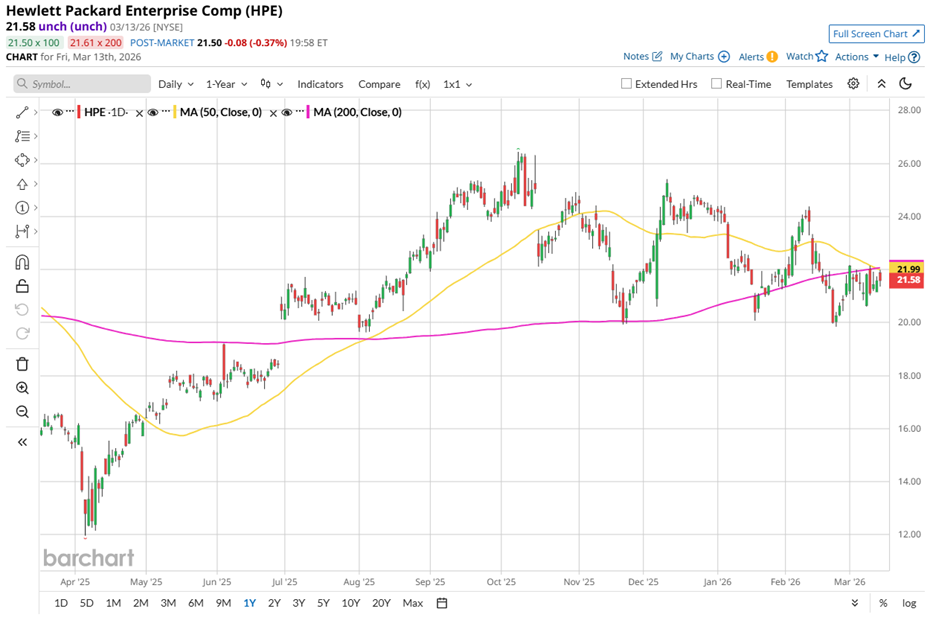
Over the past 52 weeks, HPE stock has delivered a standout run, climbing 46.1% and comfortably outpacing the Dow, which has gained 14.1%. The picture shifts in 2026, however. Year-to-date (YTD), Hewlett-Packard's shares have declined 10.2%, while the Dow slipped a milder 3.1%.
Technical indicators reinforce the near-term caution. The stock has been trading below both its 50-day moving average of $21.99 and its 200-day moving average of $22.07 since February.
Fundamentals, however, continue to lend support beneath the surface. On March 9, HPE stock rose 3.2% after the company released its fiscal 2026 first-quarter results. Revenue climbed 18.4% year over year to $9.3 billion, matching analysts’ expectations. Non-GAAP earnings grew 32.7% from the year-ago value to $0.65, ahead of the Street forecast of $0.58.
Strong demand across key infrastructure offerings, disciplined cost control, and faster-than-expected synergies from Juniper and Catalyst integrations helped drive the quarter’s performance. Management also offered a confident outlook. For fiscal 2026 Q2, the company expects revenue between $9.6 billion and $10 billion. Non-GAAP diluted EPS is projected in the range of $0.51 to $0.55.
Looking further ahead, Hewlett-Packard reaffirmed its full fiscal year 2026 revenue growth outlook of 17% to 22%. Management also raised its full-year non-GAAP diluted EPS guidance to a range of $2.30 to $2.50, a signal that leadership sees operating momentum building as the year unfolds.
To place Hewlett-Packard's price performance in a clearer context, its rival Cisco Systems, Inc. (CSCO) has gained 31.3% over the past 52 weeks, trailing HPE’s stronger rally. The gap narrows in 2026, however. Cisco’s shares have edged up 1.7% YTD, while HPE stock slipped, highlighting the latter’s recent cooling after a powerful run.
Even so, Wall Street’s stance remains optimistic. HPE stock carries a “Moderate Buy” overall rating based on coverage from 19 analysts. The mean price target of $26.19 implies potential upside of 21.4% from current levels, indicating that analysts still see room for the stock to regain momentum.
On the date of publication, Aanchal Sugandh did not have (either directly or indirectly) positions in any of the securities mentioned in this article. All information and data in this article is solely for informational purposes. For more information please view the Barchart Disclosure Policy here.
More news from Barchart