ETFOptimize | High-performance ETF-based Investment Strategies

Quantitative strategies, Wall Street-caliber research, and insightful market analysis since 1998.


ETFOptimize | HOME
Close Window

Is Rollins Stock Underperforming the S&P 500?

Atlanta, Georgia-based Rollins, Inc. (ROL) is a premier global consumer and commercial services company. Valued at $26.5 billion by market cap, the company provides essential pest and wildlife control services and protection against termite damage, rodents and insects to residential and commercial customers.

Companies worth $10 billion or more are generally described as “large-cap stocks,” and ROL perfectly fits that description, with its market cap exceeding this mark, underscoring its size, influence, and dominance within the personal services industry. Rollins' strength lies in its diversified portfolio and strong Orkin brand, driving strategic fit and high customer retention. In addition, its extensive network and training program create barriers to entry.


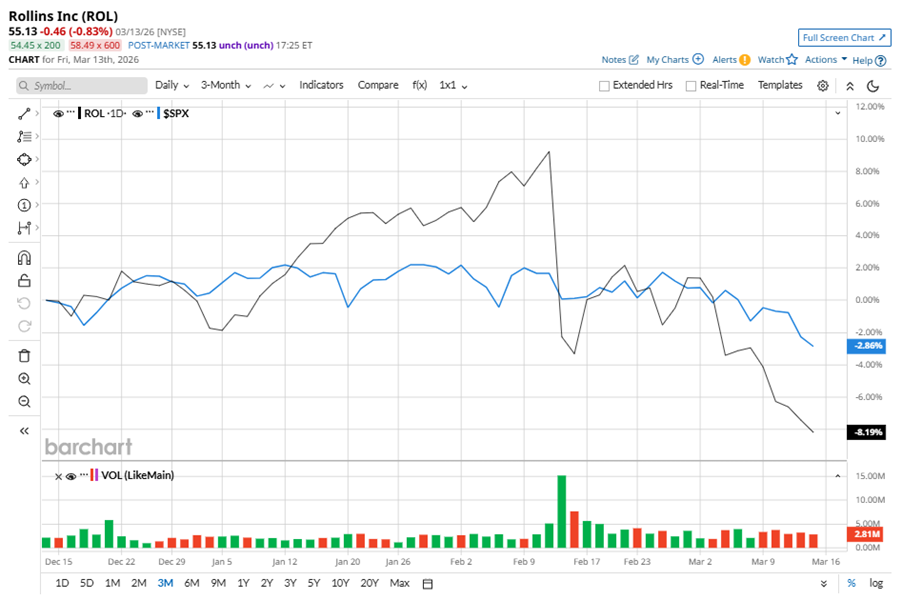
Despite its notable strength, ROL slipped 16.6% from its 52-week high of $66.14, achieved on Feb. 11. Over the past three months, ROL stock declined 8.2%, underperforming the S&P 500 Index’s ($SPX2.9% decline during the same time frame.

www.barchart.com

Shares of ROL fell 3.9% on a six-month basis but climbed 8.7% over the past 52 weeks, underperforming SPX’s six-month marginal gains and 20.1% returns over the last year.

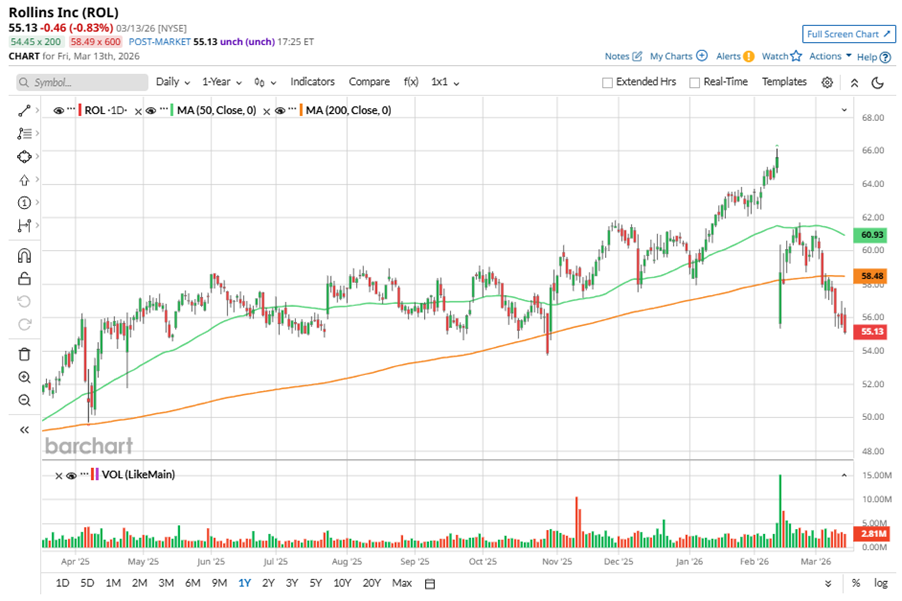
To confirm the bearish trend, ROL is trading below its 200-day moving average since early March. The stock has been trading below its 50-day moving average since mid-February.

www.barchart.com

ROL's underperformance is due to early winter weather impacting one-time pest control projects. 

On Feb. 11, ROL reported its Q4 results, and its shares closed down by 10.5% in the following trading session. Its adjusted EPS of $0.25 did not meet Wall Street expectations of $0.27. The company’s revenue was $912.9 million, missing Wall Street forecasts of $922.1 million.

In the competitive arena of personal services, E-Home Household Service Holdings Limited (EJH) has notably lagged behind ROL, with a 90.8% downtick on a six-month basis and 99.8% losses over the past 52 weeks.

Wall Street analysts are reasonably bullish on ROL’s prospects. The stock has a consensus “Moderate Buy” rating from the 16 analysts covering it, and the mean price target of $64.99 suggests a 17.9% potential upside from current price levels.


On the date of publication, Neha Panjwani did not have (either directly or indirectly) positions in any of the securities mentioned in this article. All information and data in this article is solely for informational purposes. For more information please view the Barchart Disclosure Policy here.


More news from Barchart

Recent Quotes

View More
Symbol Price Change (%)
AMZN  207.66
-2.21 (-1.05%)
AAPL  250.60
+0.66 (0.26%)
AMD  198.02
-1.44 (-0.72%)
BAC  46.18
-0.65 (-1.39%)
GOOG  303.78
-2.52 (-0.82%)
META  609.09
-6.59 (-1.07%)
MSFT  389.08
-2.71 (-0.69%)
NVDA  178.24
-2.16 (-1.20%)
ORCL  153.73
+0.83 (0.54%)
TSLA  382.76
-10.02 (-2.55%)
Stock Quote API & Stock News API supplied by www.cloudquote.io
Quotes delayed at least 20 minutes.
By accessing this page, you agree to the Privacy Policy and Terms Of Service.


IntelligentValue Home
Close Window

DISCLAIMER

All content herein is issued solely for informational purposes and is not to be construed as an offer to sell or the solicitation of an offer to buy, nor should it be interpreted as a recommendation to buy, hold or sell (short or otherwise) any security.  All opinions, analyses, and information included herein are based on sources believed to be reliable, but no representation or warranty of any kind, expressed or implied, is made including but not limited to any representation or warranty concerning accuracy, completeness, correctness, timeliness or appropriateness. We undertake no obligation to update such opinions, analysis or information. You should independently verify all information contained on this website. Some information is based on analysis of past performance or hypothetical performance results, which have inherent limitations. We make no representation that any particular equity or strategy will or is likely to achieve profits or losses similar to those shown. Shareholders, employees, writers, contractors, and affiliates associated with ETFOptimize.com may have ownership positions in the securities that are mentioned. If you are not sure if ETFs, algorithmic investing, or a particular investment is right for you, you are urged to consult with a Registered Investment Advisor (RIA). Neither this website nor anyone associated with producing its content are Registered Investment Advisors, and no attempt is made herein to substitute for personalized, professional investment advice. Neither ETFOptimize.com, Global Alpha Investments, Inc., nor its employees, service providers, associates, or affiliates are responsible for any investment losses you may incur as a result of using the information provided herein. Remember that past investment returns may not be indicative of future returns.

Copyright © 1998-2017 ETFOptimize.com, a publication of Optimized Investments, Inc. All rights reserved.