Teradyne, Inc. (TER), headquartered in North Reading, Massachusetts, is a leading global semiconductor company that designs, manufactures, and markets automated test systems and robotics products. Valued at $44.8 billion by market cap, the company's test equipment products and services include, semiconductor test systems, military, aerospace test instrumentation, circuit-board test, inspection systems, automotive diagnostic, and test systems.
Companies worth $10 billion or more are generally described as “large-cap stocks,” and TER perfectly fits that description, with its market cap exceeding this mark, underscoring its size, influence, and dominance within the semiconductor equipment & materials industry. Teradyne's strong market position is driven by its focus on optimizing its portfolio and expanding market reach, diversifies revenue streams and boosts growth potential. The company's ability to streamline operations and concentrate on high-growth areas further solidifies its competitive position.
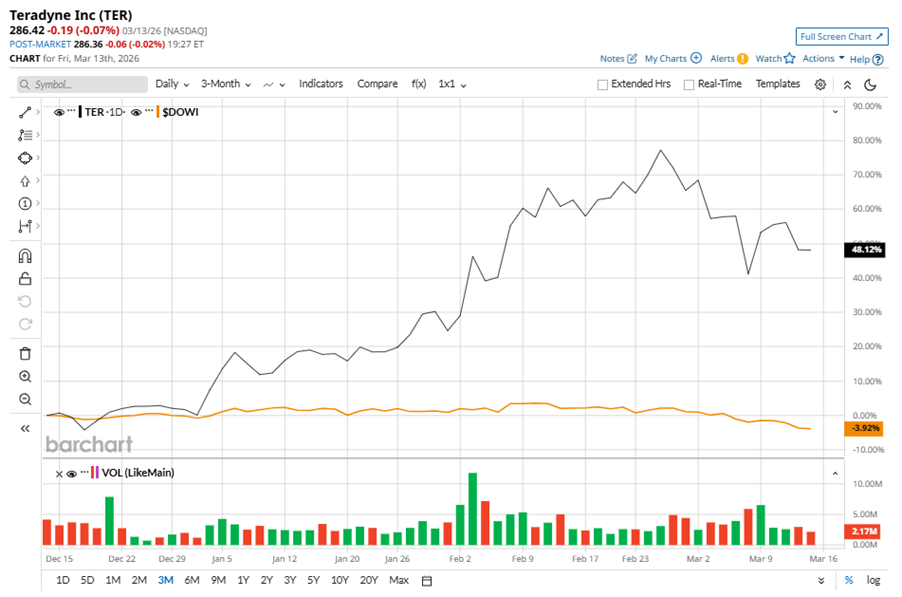
Despite its notable strength, TER slipped 17% from its 52-week high of $344.92, achieved on Feb. 26. Over the past three months, TER stock has surged 48.1%, considerably outperforming the Dow Jones Industrials Average’s ($DOWI) 3.9% dip during the same time frame.
Shares of TER rose 155.2% on a six-month basis and climbed 235.7% over the past 52 weeks, significantly outperforming DOWI’s six-month gains of 1.6% and solid 14.1% returns over the last year.
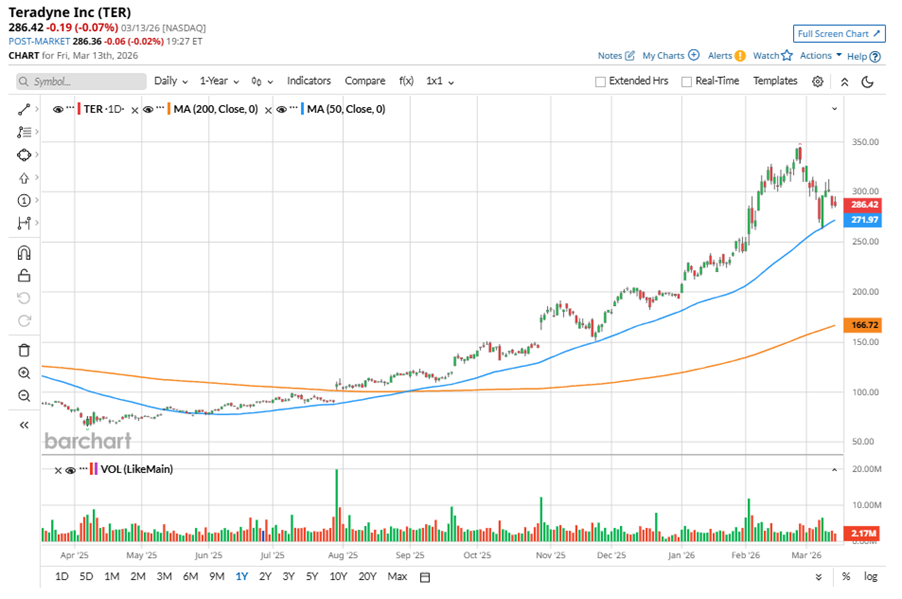
To confirm the bullish trend, TER has been trading above its 50-day moving average since mid-May, 2025, with a minor fluctuation. The stock has been trading above its 200-day moving average since late July, 2025.
On Feb. 2, TER reported its Q4 results, and its shares closed up more than 13% in the following trading session. Its adjusted EPS of $1.80 topped Wall Street expectations of $1.36. The company’s revenue was $1.1 billion, topping Wall Street forecasts of $968.8 million. For Q1 2026, TER expects its adjusted EPS to range from $1.89 to $2.25, and revenue in the range of $1.2 billion to $1.3 billion.
In the competitive arena of semiconductor equipment & materials, Advantest Corporation (ATEYY) has lagged behind TER, with 173.4% gains over the past 52 weeks and 14.6% uptick on a six-month basis.
Wall Street analysts are reasonably bullish on TER’s prospects. The stock has a consensus “Moderate Buy” rating from the 17 analysts covering it, and the mean price target of $309.40 suggests an 8% potential upside from current price levels.
On the date of publication, Neha Panjwani did not have (either directly or indirectly) positions in any of the securities mentioned in this article. All information and data in this article is solely for informational purposes. For more information please view the Barchart Disclosure Policy here.
More news from Barchart