ETFOptimize | High-performance ETF-based Investment Strategies

Quantitative strategies, Wall Street-caliber research, and insightful market analysis since 1998.


ETFOptimize | HOME
Close Window

Is Willis Towers Watson Stock Underperforming the Nasdaq?

London, the United Kingdom-based Willis Towers Watson Public Limited Company (WTW) is a leading global advisory, broking, and solutions firm with a market cap of $27.4 billion. It provides a comprehensive suite of services, including human capital consulting, benefits administration, investment advisory, and specialized corporate risk management and insurance brokerage.

Companies valued at $10 billion or more are typically classified as “large-cap stocks,” and WTW fits the label perfectly, with its market cap exceeding this threshold, underscoring its size, influence, and dominance within the insurance brokers industry. The company’s core strengths lie in its deep technical expertise, particularly in actuarial science and insurance consulting technology, where it leverages proprietary software suites like Radar and ResQ to serve global insurers.


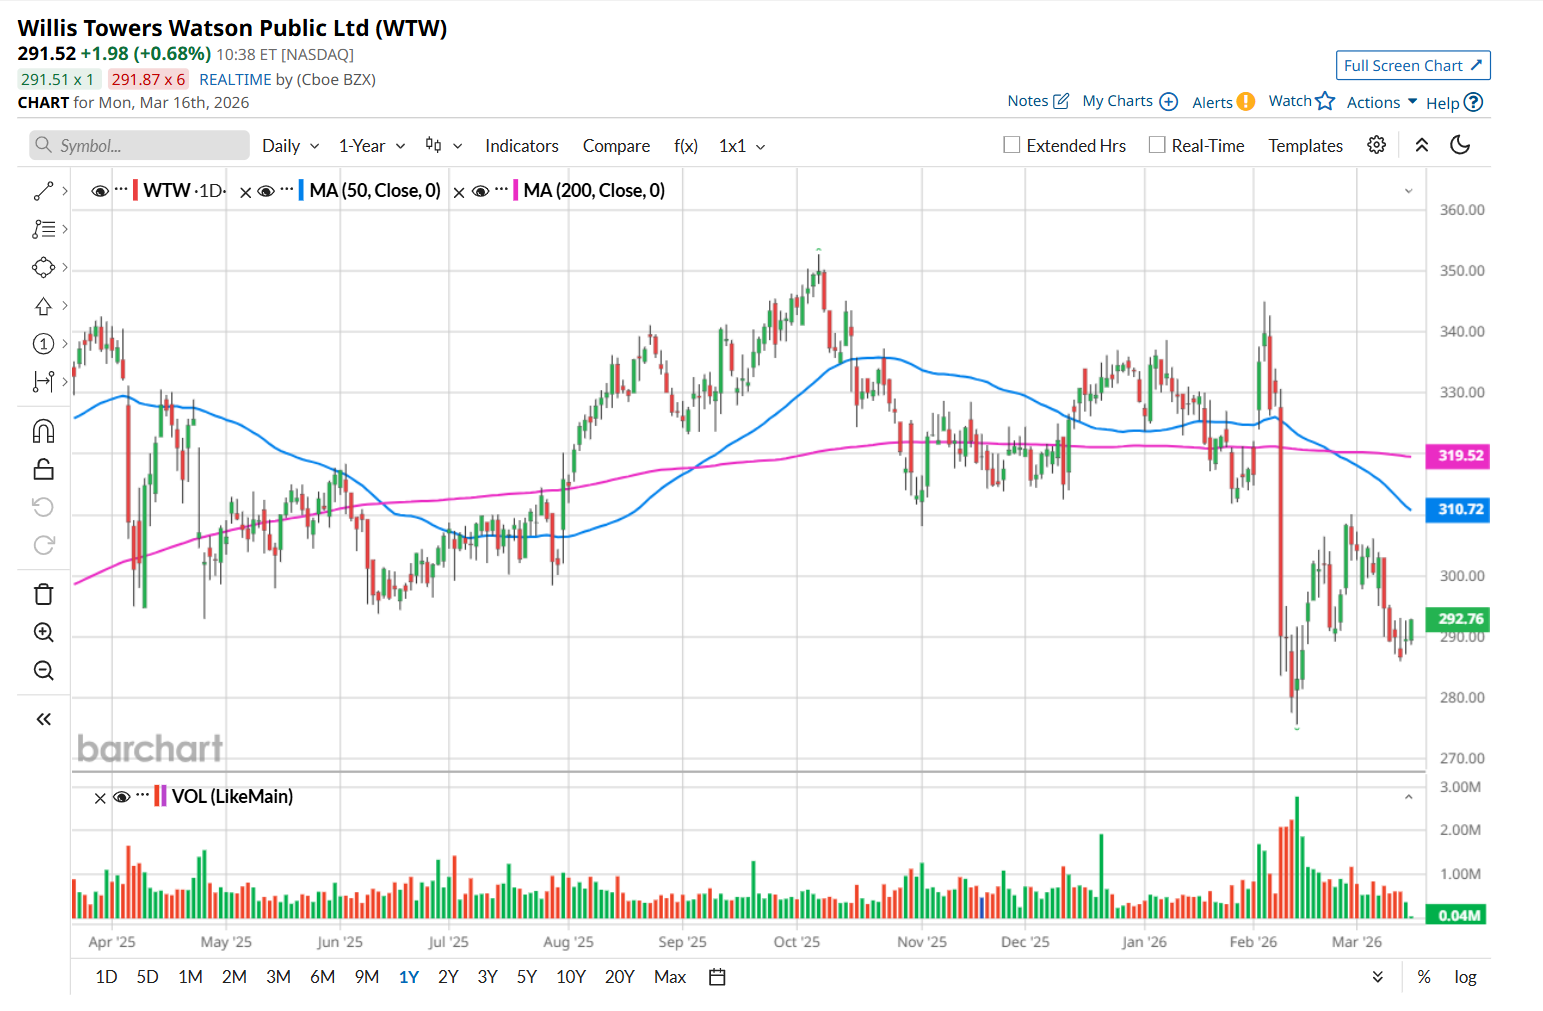
This financial company has dipped 17.1% from its 52-week high of $352.79, reached on Oct. 7, 2025. Shares of WTW have declined 11.4% over the past three months, underperforming the Nasdaq Composite’s ($NASX3.1% drop during the same time frame.

www.barchart.com 

Moreover, on a YTD basis, shares of WTW are down 11.1%, compared to NASX’s 3.7% fall. In the longer term, WTW has fallen 10% over the past 52 weeks, lagging behind NASX’s 26.1% uptick over the same time frame. 

To confirm its bearish trend, WTW has been trading below its 200-day and 50-day moving averages since early February. 

www.barchart.com 

Willis, a WTW business, announced the continued expansion of its GB Affinity technology ecosystem through a strategic partnership with Qover, a European leader in embedded insurance orchestration. This collaboration aims to address the growing demand for seamless and contextual insurance solutions at the point of sale. Through this partnership, Willis and Qover will deliver a product-agnostic platform that enables businesses to launch customized insurance programs efficiently and at scale, while also supporting innovation, sustainability, and evolving customer needs.

WTW has outperformed its rival, Marsh & McLennan Companies, Inc. (MRSH), which declined 24.6% over the past 52 weeks. However, it has lagged MRSH’s 6% YTD drop.  

Despite WTW’s recent underperformance, analysts remain moderately optimistic about its prospects. The stock has a consensus rating of "Moderate Buy” from the 23 analysts covering it, and the mean price target of $369.63 suggests a 27.1% premium to its current price levels. 


On the date of publication, Neharika Jain did not have (either directly or indirectly) positions in any of the securities mentioned in this article. All information and data in this article is solely for informational purposes. For more information please view the Barchart Disclosure Policy here.

Recent Quotes

View More
Symbol Price Change (%)
AMZN  209.87
-5.33 (-2.48%)
AAPL  249.94
-4.29 (-1.69%)
AMD  199.46
+3.15 (1.60%)
BAC  46.83
-0.45 (-0.95%)
GOOG  306.30
-3.11 (-1.01%)
META  615.68
-6.98 (-1.12%)
MSFT  391.79
-7.62 (-1.91%)
NVDA  180.40
-1.53 (-0.84%)
ORCL  152.90
-1.79 (-1.16%)
TSLA  392.78
-6.49 (-1.63%)
Stock Quote API & Stock News API supplied by www.cloudquote.io
Quotes delayed at least 20 minutes.
By accessing this page, you agree to the Privacy Policy and Terms Of Service.


IntelligentValue Home
Close Window

DISCLAIMER

All content herein is issued solely for informational purposes and is not to be construed as an offer to sell or the solicitation of an offer to buy, nor should it be interpreted as a recommendation to buy, hold or sell (short or otherwise) any security.  All opinions, analyses, and information included herein are based on sources believed to be reliable, but no representation or warranty of any kind, expressed or implied, is made including but not limited to any representation or warranty concerning accuracy, completeness, correctness, timeliness or appropriateness. We undertake no obligation to update such opinions, analysis or information. You should independently verify all information contained on this website. Some information is based on analysis of past performance or hypothetical performance results, which have inherent limitations. We make no representation that any particular equity or strategy will or is likely to achieve profits or losses similar to those shown. Shareholders, employees, writers, contractors, and affiliates associated with ETFOptimize.com may have ownership positions in the securities that are mentioned. If you are not sure if ETFs, algorithmic investing, or a particular investment is right for you, you are urged to consult with a Registered Investment Advisor (RIA). Neither this website nor anyone associated with producing its content are Registered Investment Advisors, and no attempt is made herein to substitute for personalized, professional investment advice. Neither ETFOptimize.com, Global Alpha Investments, Inc., nor its employees, service providers, associates, or affiliates are responsible for any investment losses you may incur as a result of using the information provided herein. Remember that past investment returns may not be indicative of future returns.

Copyright © 1998-2017 ETFOptimize.com, a publication of Optimized Investments, Inc. All rights reserved.