ETFOptimize | High-performance ETF-based Investment Strategies

Quantitative strategies, Wall Street-caliber research, and insightful market analysis since 1998.


ETFOptimize | HOME
Close Window

How Is Corpay's Stock Performance Compared to Other Digital Payment Stocks?

Valued at a market cap of $21.7 billion, Corpay, Inc. (CPAY) is a payments company based in Atlanta, Georgia, that helps businesses and consumers manage and pay their expenses.

Companies worth $10 billion or more are typically classified as “large-cap stocks,” and CPAY fits the label perfectly, with its market cap exceeding this threshold, underscoring its size, influence, and dominance within the software - infrastructure industry. The company specializes in corporate payment solutions, including accounts payable (AP) automation, cross-border payments, and commercial card programs.


This fintech company has slipped 16.9% from its 52-week high of $361.99, reached on Feb. 10. Shares of CPAY have declined 2.1% over the past three months, outperforming the Amplify Digital Payments ETF’s (IPAY15.6% drop during the same time frame.

www.barchart.com 

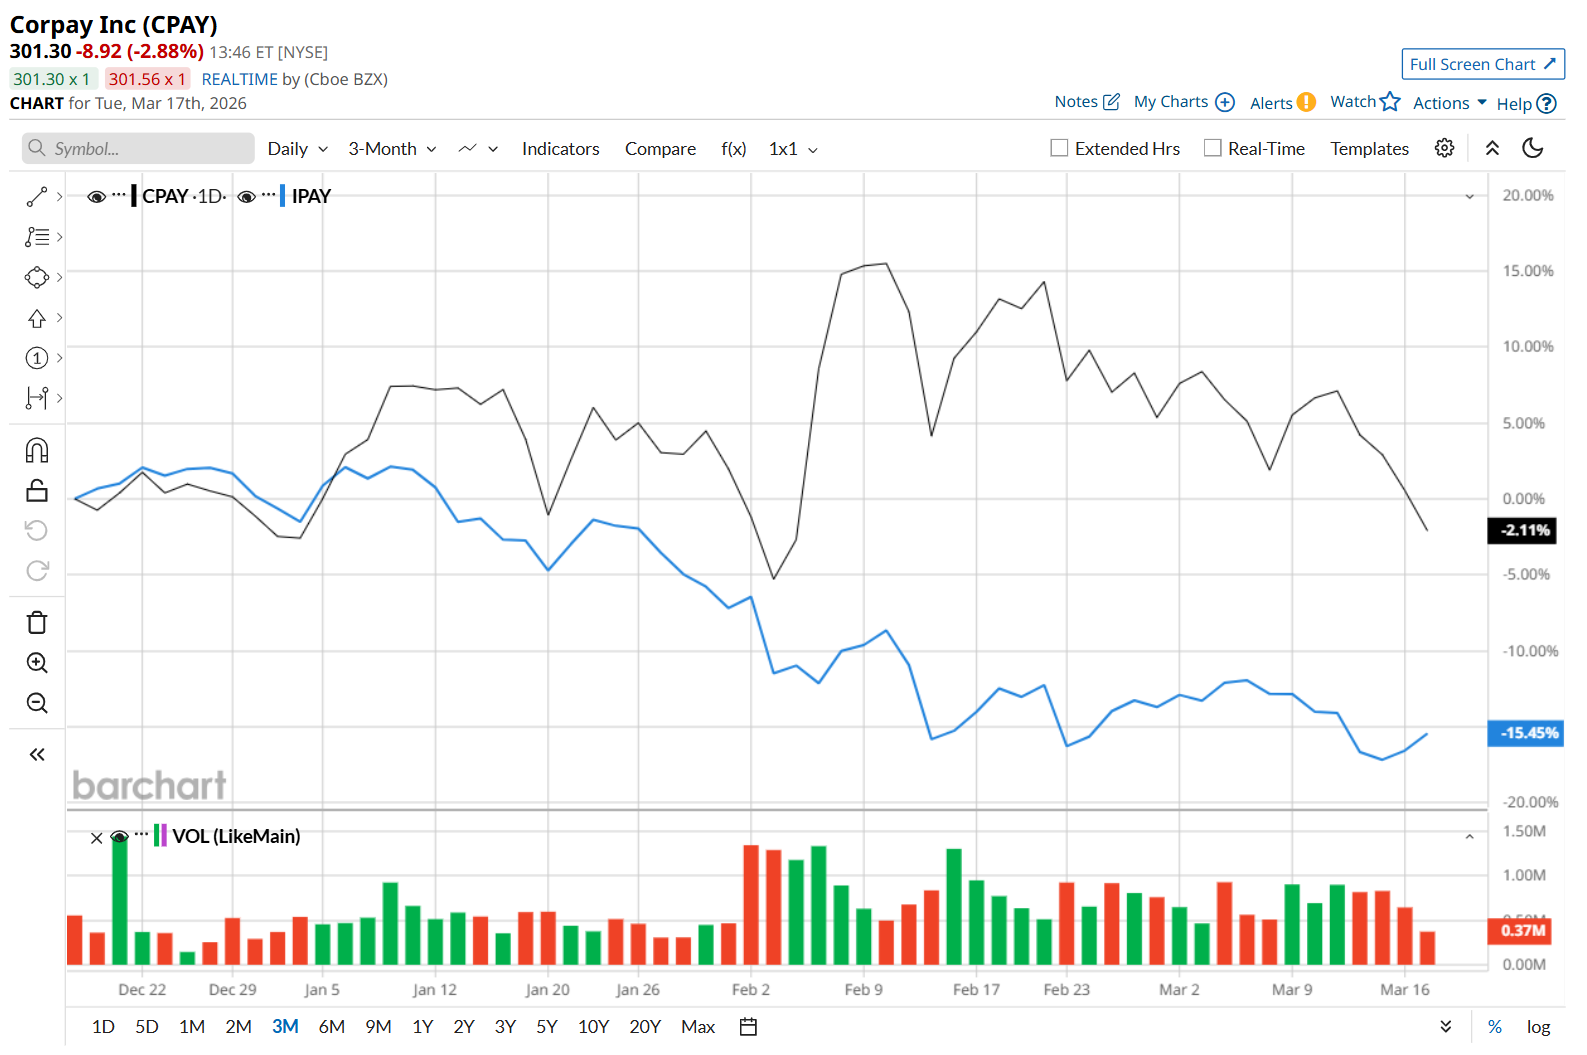
Moreover, in the longer term, CPAY has dropped 13% over the past 52 weeks, outpacing IPAY’s 18.1% fall over the same time frame. On a YTD basis, shares of CPAY are up marginally, compared to IPAY’s 15.1% loss. 

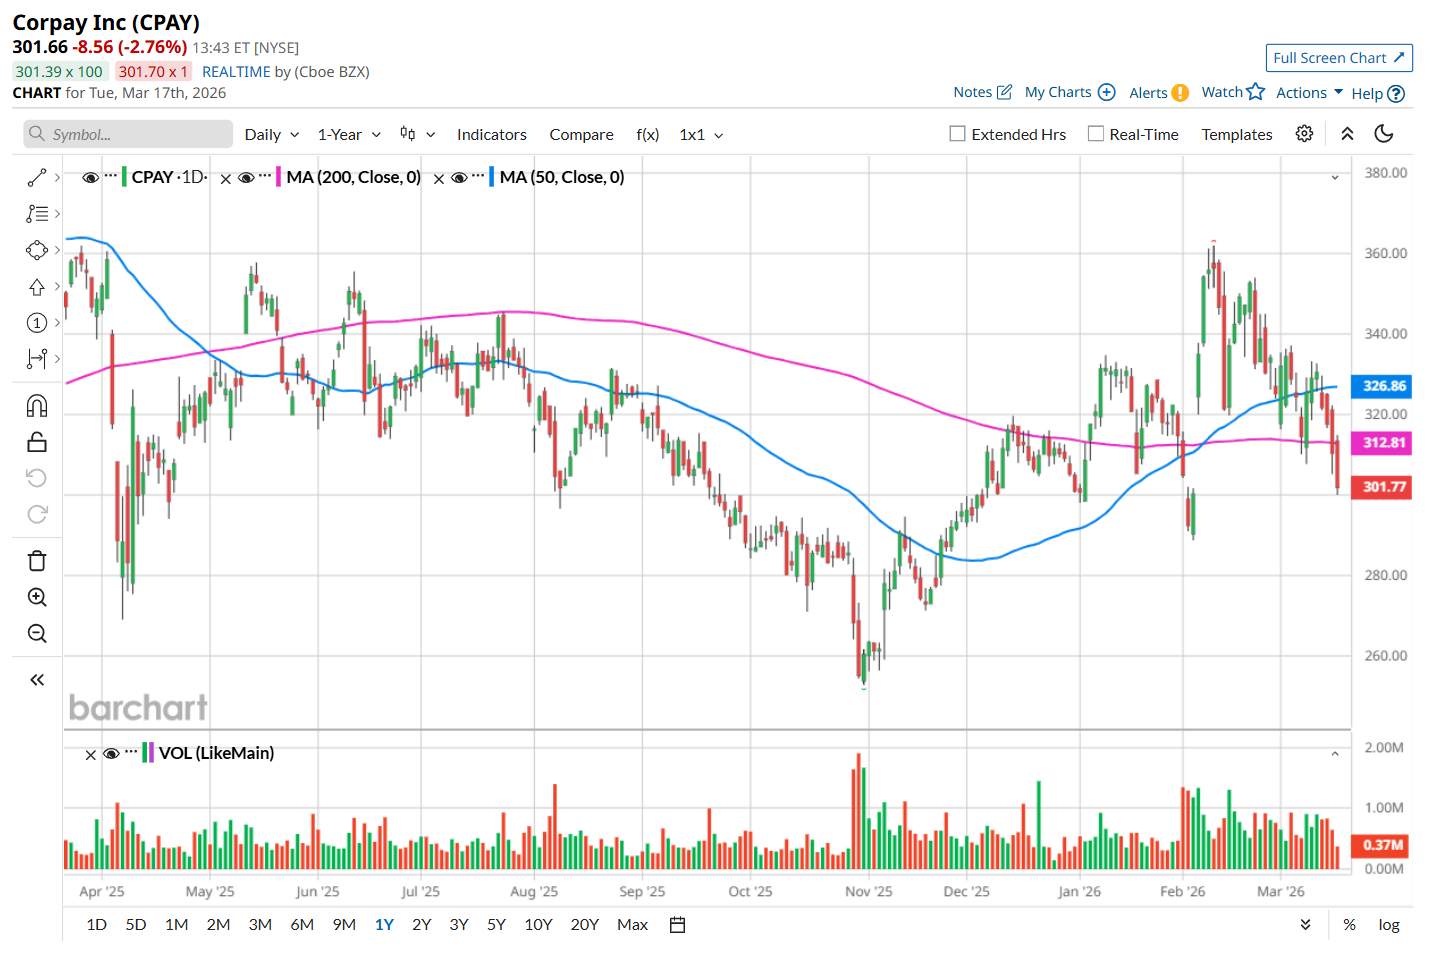
To confirm its bearish trend, CPAY has started trading below its 200-day and 50-day moving averages since mid-March. 

www.barchart.com 

On Feb. 4, CPAY delivered impressive Q4 results, prompting its shares to surge 11.6% in the following trading session. The company’s revenue increased nearly 21% year-over-year to $1.25 billion, with organic growth of approximately 11%. Its adjusted EPS rose 13% from the year-ago quarter to $6.04, also surpassing estimates. The performance pointed to strong underlying demand, particularly in the corporate payments segment, which delivered 16% organic growth despite facing a roughly 200-basis-point drag from lower interest rates.

CPAY has outpaced its rival, Global Payments Inc. (GPN), which dropped 24.1% over the past 52 weeks and 6.2% on a YTD basis. 

Given CPAY’s recent outperformance relative to its industry peers, analysts remain moderately optimistic about its prospects. The stock has a consensus rating of "Moderate Buy” from the 16 analysts covering it, and the mean price target of $389.14 suggests a 29.6% premium to its current price levels. 


On the date of publication, Neharika Jain did not have (either directly or indirectly) positions in any of the securities mentioned in this article. All information and data in this article is solely for informational purposes. For more information please view the Barchart Disclosure Policy here.


More news from Barchart

Recent Quotes

View More
Symbol Price Change (%)
AMZN  209.87
+0.00 (0.00%)
AAPL  249.94
+0.00 (0.00%)
AMD  199.46
+0.00 (0.00%)
BAC  46.83
+0.00 (0.00%)
GOOG  306.30
+0.00 (0.00%)
META  615.68
+0.00 (0.00%)
MSFT  391.79
+0.00 (0.00%)
NVDA  180.40
+0.00 (0.00%)
ORCL  152.90
+0.00 (0.00%)
TSLA  392.78
+0.00 (0.00%)
Stock Quote API & Stock News API supplied by www.cloudquote.io
Quotes delayed at least 20 minutes.
By accessing this page, you agree to the Privacy Policy and Terms Of Service.


IntelligentValue Home
Close Window

DISCLAIMER

All content herein is issued solely for informational purposes and is not to be construed as an offer to sell or the solicitation of an offer to buy, nor should it be interpreted as a recommendation to buy, hold or sell (short or otherwise) any security.  All opinions, analyses, and information included herein are based on sources believed to be reliable, but no representation or warranty of any kind, expressed or implied, is made including but not limited to any representation or warranty concerning accuracy, completeness, correctness, timeliness or appropriateness. We undertake no obligation to update such opinions, analysis or information. You should independently verify all information contained on this website. Some information is based on analysis of past performance or hypothetical performance results, which have inherent limitations. We make no representation that any particular equity or strategy will or is likely to achieve profits or losses similar to those shown. Shareholders, employees, writers, contractors, and affiliates associated with ETFOptimize.com may have ownership positions in the securities that are mentioned. If you are not sure if ETFs, algorithmic investing, or a particular investment is right for you, you are urged to consult with a Registered Investment Advisor (RIA). Neither this website nor anyone associated with producing its content are Registered Investment Advisors, and no attempt is made herein to substitute for personalized, professional investment advice. Neither ETFOptimize.com, Global Alpha Investments, Inc., nor its employees, service providers, associates, or affiliates are responsible for any investment losses you may incur as a result of using the information provided herein. Remember that past investment returns may not be indicative of future returns.

Copyright © 1998-2017 ETFOptimize.com, a publication of Optimized Investments, Inc. All rights reserved.