Headquartered in Springfield, Massachusetts, Eversource Energy (ES) delivers electricity, natural gas, and water across the northeastern United States. It operates transmission and distribution networks, runs solar assets, and serves residential, commercial, industrial, and municipal customers through regulated infrastructure.
With a market cap of approximately $27.4 billion, the company sits in the “large-cap” territory, a space reserved for firms valued above $10 billion. The scale reinforces its stability and signals a well-entrenched position within the regulated utilities landscape.
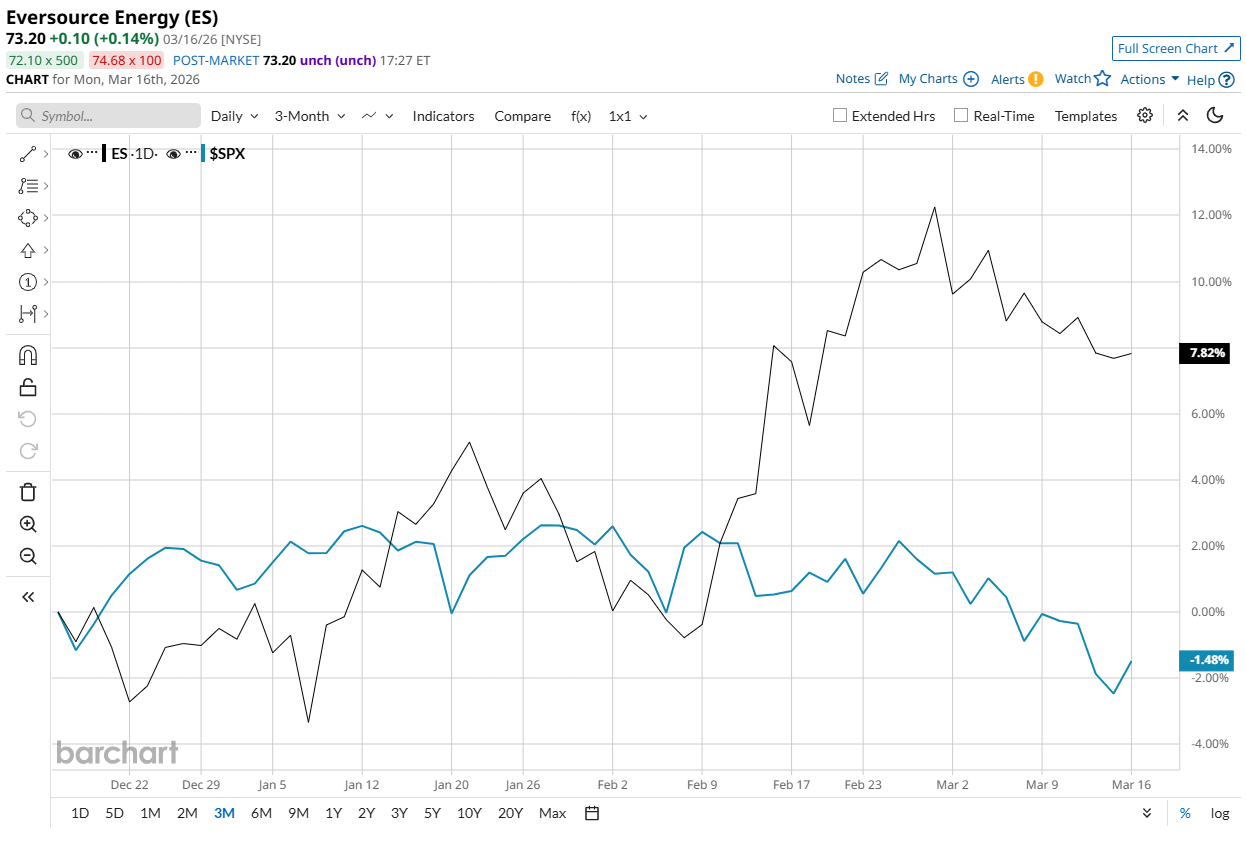
Eversource’s shares currently trade 4.2% below their 52-week high of $76.41 reached in February. Shares have surged 7.8% over the past three months, outpacing the broader market as the S&P 500 Index ($SPX) declined 1.5% over the same period.
A wider lens only strengthens the narrative. Over the past 52 weeks, the stock has delivered a 19.2% gain, edging past the S&P 500’s 18.8% return. In 2026, the gap has widened further, with Eversource up 8.7% while the broader index has declined 2.1% year-to-date (YTD).
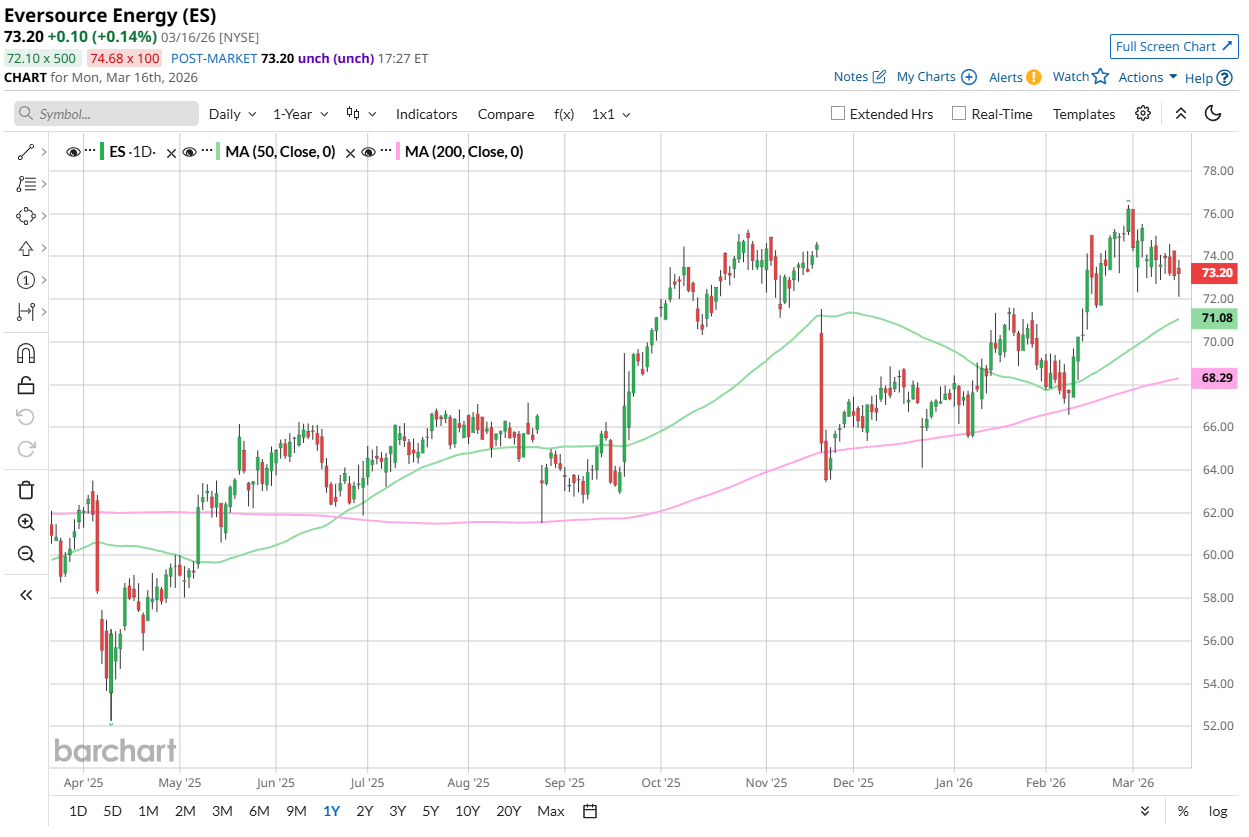
Technical indicators align with the narrative. The stock has held above its 50-day moving average of $71.08 and 200-day moving average of $68.29 since February, reinforcing a firm upward trend.
On Feb. 12, Eversource unveiled Q4 fiscal 2025 results that stayed true to its steady script. Revenue came in at $3.37 billion, missing the Street's $3.41 billion estimate but growing 13.4% year over year. EPS reached $1.12, topping analysts' forecast of $1.10 analyst and improving 460% annually. This lifted shares 4.3% in the next trading session as execution took center stage.
Looking ahead, Eversource’s management projects fiscal year 2026 EPS between $4.80 and $4.95. They expect cumulative long-term EPS growth in the range of 5% to 7% through 2030, using its 2025 non-GAAP base of $4.76 per share.
Peer comparison, however, introduces a note of caution. Rival Ameren Corporation (AEE) has outpaced Eversource, posting a 13.9% gain over the past 52 weeks and rising 13% YTD. The contrast suggests that while Eversource holds its ground, it has not fully captured the sector’s upside.
Wall Street reflects a measured perspective. Among 15 analysts, the consensus rating stands at “Hold,” signaling cautious optimism. With an average price target of $75.67, the stock carries 3.4% upside potential from current levels, suggesting steady, disciplined growth.
On the date of publication, Aanchal Sugandh did not have (either directly or indirectly) positions in any of the securities mentioned in this article. All information and data in this article is solely for informational purposes. For more information please view the Barchart Disclosure Policy here.
More news from Barchart
- This Dividend King With a 54-Year Dividend Streak Is Down 13% YTD. Time to Buy the Dip?
- What Options Traders Expect from Micron Stock After Earnings on March 18
- Meta Platforms Just Announced 4 New In-House AI Chips. Does That Make META Stock a Buy Here?
- Should You Buy Palantir Stock After AIPCon 2026?


