With a market cap of $19.1 billion, Expeditors International of Washington, Inc. (EXPD) is a global logistics company that provides airfreight, ocean freight, customs brokerage, and supply chain solutions across the Americas, Asia, Europe, and other regions. It offers a wide range of services, including transportation, warehousing, cargo tracking, insurance, and trade compliance consulting, to support international shipping needs.
Companies valued at $10 billion or more are generally considered "large-cap" stocks, and Expeditors fits this criterion perfectly. The company also handles documentation, consolidation, and specialized logistics services for efficient global trade.
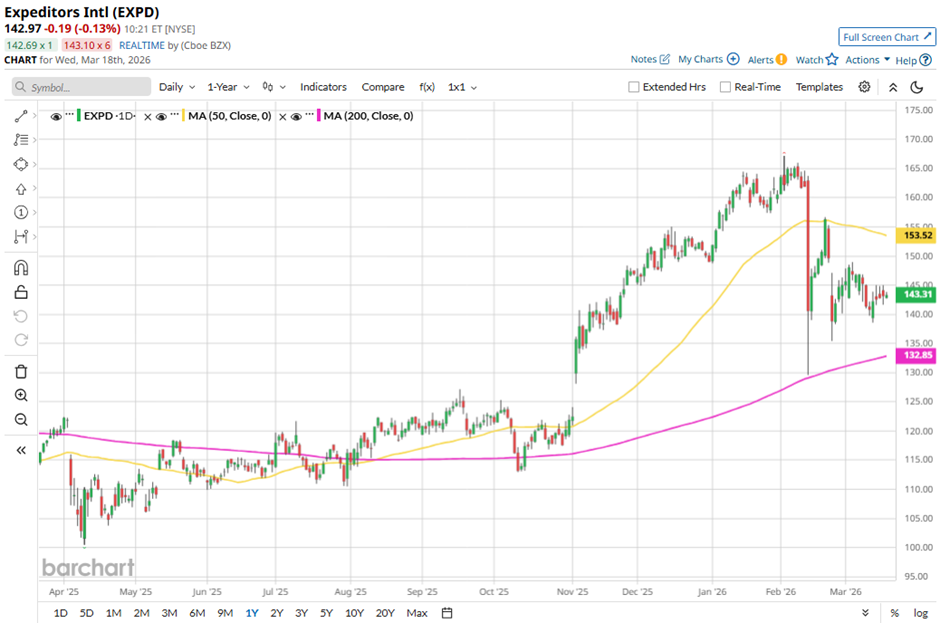
EXPD stock has dropped 14.4% from its 52-week high of $167.19. Shares of the Bellevue, Washington-based company have fallen 4.8% over the past three months, underperforming the State Street Industrial Select Sector SPDR ETF’s (XLI) 8.1% rise over the same time frame.
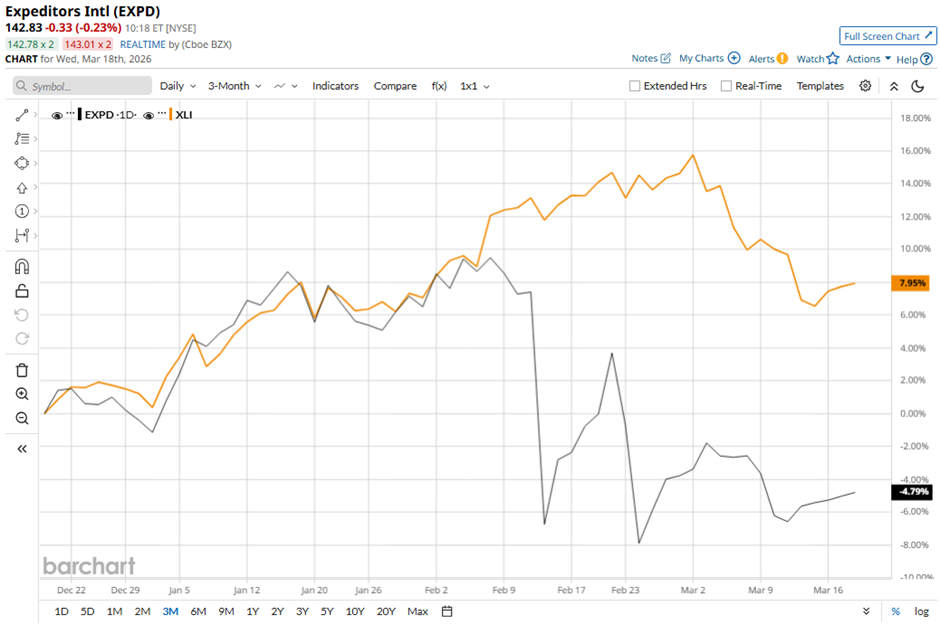
EXPD stock is down 3.8% on a YTD basis, lagging behind XLI’s 7.7% gain. In the longer term, shares of the company have increased 22.4% over the past 52 weeks, compared to XLI’s 26.7% return over the same time frame.
Yet, the stock has been trading above its 200-day average since August 2025. However, it has fallen below its 50-day moving average since early February this year.
Shares of Expeditors fell 7.2% on Feb. 24 after the company reported Q4 2025 results, with EPS declining 11% to $1.49, net earnings down 15% to $201 million, and operating income falling 17% to $251 million. Revenue also slipped 3% to $2.9 billion, while ocean freight performance was particularly weak, with container volume down 6% and revenue per container plunging 41% year-over-year due to falling rates. Additionally, margin pressure in airfreight and expectations of continued soft ocean rates in 2026 further dampened investor sentiment.
In comparison, EXPD stock has underperformed compared to its rival, J.B. Hunt Transport Services, Inc. (JBHT). Shares of J.B. Hunt have gained 35% over the past 52 weeks and 2.2% on a YTD basis.
Due to the stock’s weak performance, analysts remain cautious about its prospects. EXPD stock has a consensus rating of “Hold” from the 16 analysts covering it, and as of writing, the stock is trading above the mean price target of $140.77.
On the date of publication, Sohini Mondal did not have (either directly or indirectly) positions in any of the securities mentioned in this article. All information and data in this article is solely for informational purposes. For more information please view the Barchart Disclosure Policy here.
More news from Barchart
- Add Global Exposure to Your Portfolio with This 1 Norwegian ETF
- Meta Could Cut 20% of Its Jobs as AI Costs Pile Up. Should You Buy, Sell, or Hold META Stock Before Layoffs?
- Dear Tesla Stock Fans, Mark Your Calendars for March 21
- Disney Gets a New Executive Team As 'Iger Era' Ends: Does That Make DIS Stock a Buy?


