With a market cap of $25.4 billion, Northern Trust Corporation (NTRS) provides wealth management, asset servicing, asset management, and banking solutions to institutions, corporations, and high-net-worth individuals. The company operates through two main segments: Asset Servicing, which delivers custody, fund administration, and investment-related services to institutional investors, and Wealth Management, which offers trust, investment, and private banking services to individuals and families.
Companies valued less than $10 billion are generally classified as “mid-cap” stocks, and Northern Trust fits this criterion perfectly. It also provides a wide range of asset management products, including equity, fixed income, multi-asset, and alternative investments, along with risk management and advisory solutions.
Shares of the Chicago, Illinois-based company have decreased 13.2% from its 52-week high of $157.60. NTRS stock has fallen marginally over the past three months, a less pronounced decline than the Nasdaq Composite’s ($NASX) 2.3% drop over the same time frame.
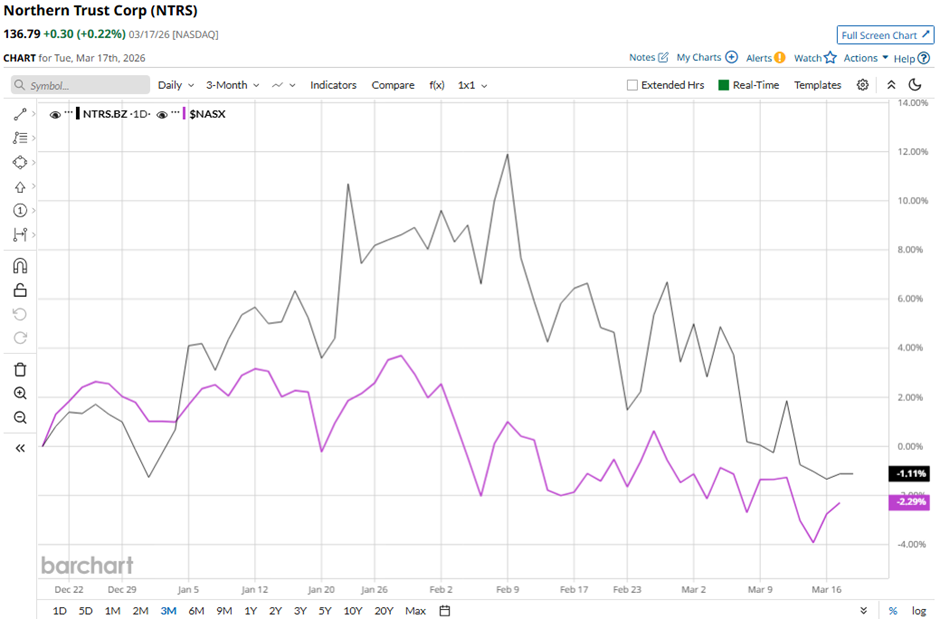
NTRS stock has risen marginally on a YTD basis, outpacing NASX’s 3.3% dip. Moreover, shares of Northern Trust have soared 38.6% over the past 52 weeks, compared to NASX’s 28.4% return over the same time frame.
The stock has been trading below its 50-day and 200-day moving averages since May 2025. However, it has fallen below its 50-day moving average since March this year.
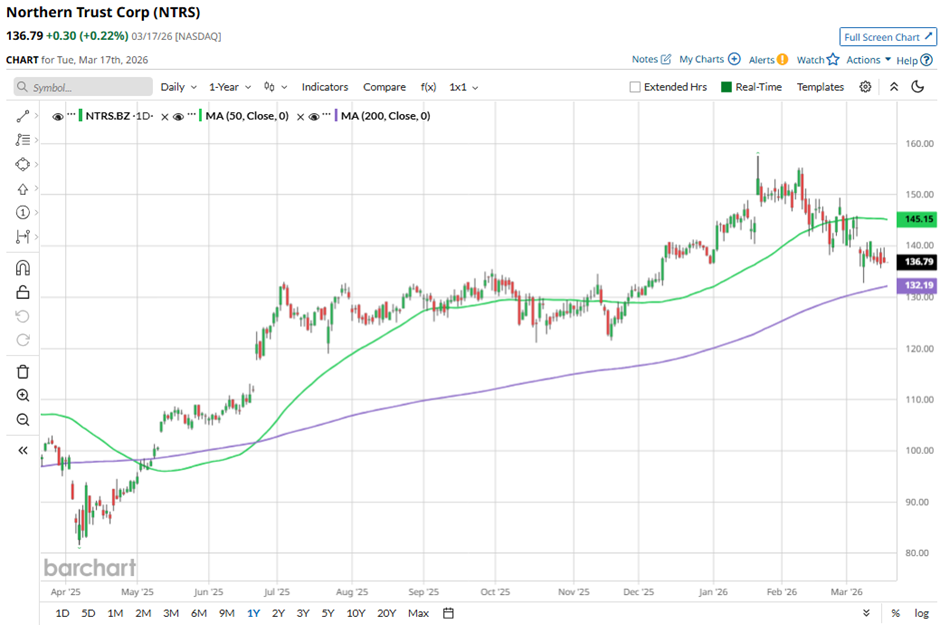
Shares of Northern Trust jumped over 6% on Jan. 22 after the company reported Q4 2025 results, with EPS of $2.42 and revenue of $2.14 billion, both exceeding the consensus. The upside was driven by robust net interest income of $654.3 million (well above the estimate) and solid servicing fee growth, with trust and investment fees reaching $1.31 billion and asset servicing income rising 23% year-over-year.
In comparison, rival T. Rowe Price Group, Inc. (TROW) has lagged behind NTRS stock. TROW stock has dropped 13.7% on a YTD basis and 6.3% over the past 52 weeks.
Despite the stock’s strong performance, analysts remain cautious on its prospects. NTRS stock has a consensus rating of “Hold” from the 17 analysts in coverage, and the mean price target of $159.03 is a premium of 16.3% to current levels.
On the date of publication, Sohini Mondal did not have (either directly or indirectly) positions in any of the securities mentioned in this article. All information and data in this article is solely for informational purposes. For more information please view the Barchart Disclosure Policy here.
More news from Barchart
- 1 Nvidia-Backed Stock to Buy Now If You Are Betting on Physical AI
- Wall Street Is Still Betting on a Memory ‘Super-Cycle.’ Should You Buy MU Stock Here?
- The Big Short… or The Big Mistake? Why Michael Burry Is Betting Against Nvidia (and What the Data Says)
- 3 High Dividend Growth Kings for Generations of Income That Are Still Rated ‘Buy’


