Omnicom Group Inc. (OMC) is a global holding company that oversees operations in advertising, marketing services, customer relationship management, public relations, and specialty communications. Its agencies deliver creative, data-driven solutions worldwide. Headquartered in New York City, it manages a portfolio of leading branded networks. The company has a market capitalization of $24.43 billion, classifying it as a “big-cap” stock.
Its shares reached a 52-week high of $87.17 on Mar. 5, but are down 10.1% from that level. Concerns about massive integration expenses following Omnicom’s merger with Interpublic Group have weighed on the stock. Over the past three months, the stock has declined 5.2%. On the other hand, the State Street Communication Services Select Sector SPDR ETF (XLC) is only marginally down over the same period.
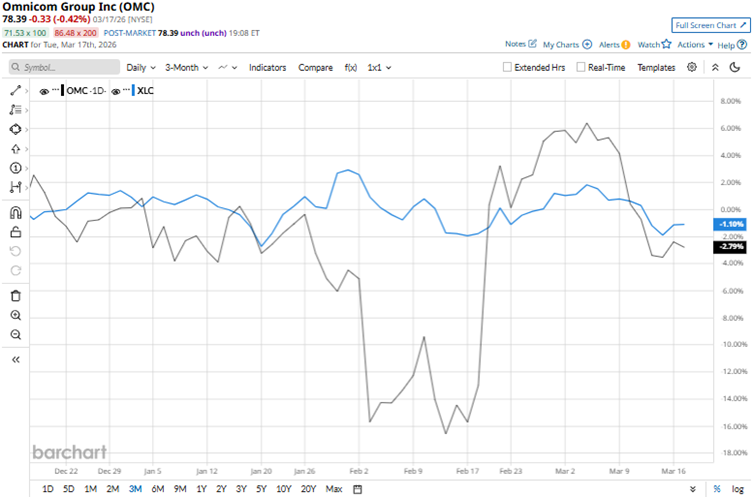
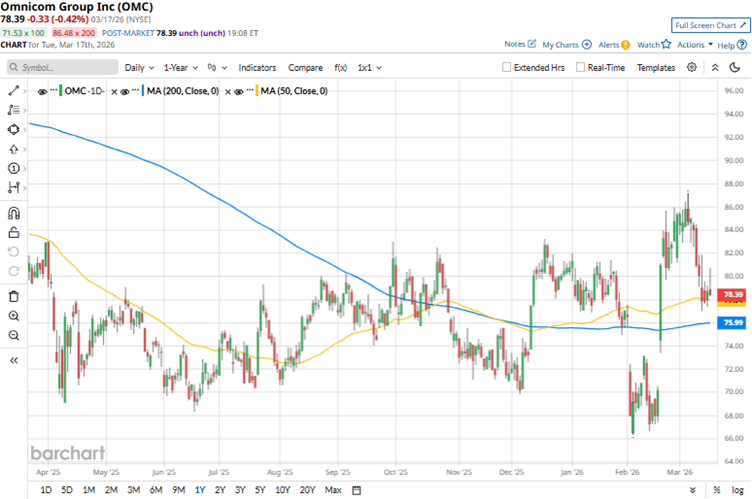
Over the past 52 weeks, Omnicom’s stock dropped 2.4%, while the Communication Services SPDR ETF gained 18.6%. However, the stock has risen 2.3% over the past six months, while the ETF has fallen 2.9%. Omnicom’s shares have traded above their 200-day moving average since late February, while they are currently hovering near their 50-day moving average.
In November, Omnicom completed its acquisition of The Interpublic Group of Companies, Inc., which created a leading marketing and sales company. The $13 billion purchase of its rival firm aims to gain some traction in the shifting advertising landscape. Following this mega-merger, Omnicom announced 4,000 job cuts and folded several well-known advertising agency brands.
In its fourth-quarter earnings release, the company highlighted that it has doubled its total cost synergy target to $1.50 billion, which includes $900 million in 2026. Omnicom’s Q4 revenue increased by 27.9% year-over-year (YOY) to $5.53 billion, while its adjusted EPS climbed 7.5% YOY to $2.59.
We compare Omnicom’s performance with that of another advertising agency stock, Stagwell Inc. (STGW), which is up marginally over the past 52 weeks, 16.5% over the past six months, and 14.3% over the past three months. Therefore, OMC has been the clear underperformer over these periods.
Wall Street analysts are moderately bullish on Omnicom’s stock. The stock has a consensus rating of “Moderate Buy” from the 10 analysts covering it. The mean price target of $99.33 implies a 26.7% upside from current levels. The Street-high price target of $117 indicates a 49.3% upside.
On the date of publication, Anushka Dutta did not have (either directly or indirectly) positions in any of the securities mentioned in this article. All information and data in this article is solely for informational purposes. For more information please view the Barchart Disclosure Policy here.
More news from Barchart
- Massive Meatpacking Strike: What Does It Mean for Beef Prices, Cattle as 3,800 Workers Go on Strike?
- 1 Nvidia-Backed Stock to Buy Now If You Are Betting on Physical AI
- Wall Street Is Still Betting on a Memory ‘Super-Cycle.’ Should You Buy MU Stock Here?
- The Big Short… or The Big Mistake? Why Michael Burry Is Betting Against Nvidia (and What the Data Says)


