ETFOptimize | High-performance ETF-based Investment Strategies

Quantitative strategies, Wall Street-caliber research, and insightful market analysis since 1998.


ETFOptimize | HOME
Close Window

Is Carnival Stock Underperforming the Dow?

Valued at a market cap of $31.1 billion, Carnival Corporation & plc (CCL) is a cruise company that provides leisure travel services. Beyond its maritime operations, this Miami, Florida-based company also owns and operates a network of hotels, lodges, and luxury glass-domed railcars. 

Companies worth $10 billion or more are typically classified as “large-cap stocks,” and CCL fits the label perfectly, with its market cap exceeding this threshold, underscoring its size, influence, and dominance within the travel services industry. The company’s core strengths lie in its massive global scale, capturing nearly 40% of the cruise market share, and its high-margin "proprietary destination" strategy, exemplified by its private Bahamian port, Celebration Key.


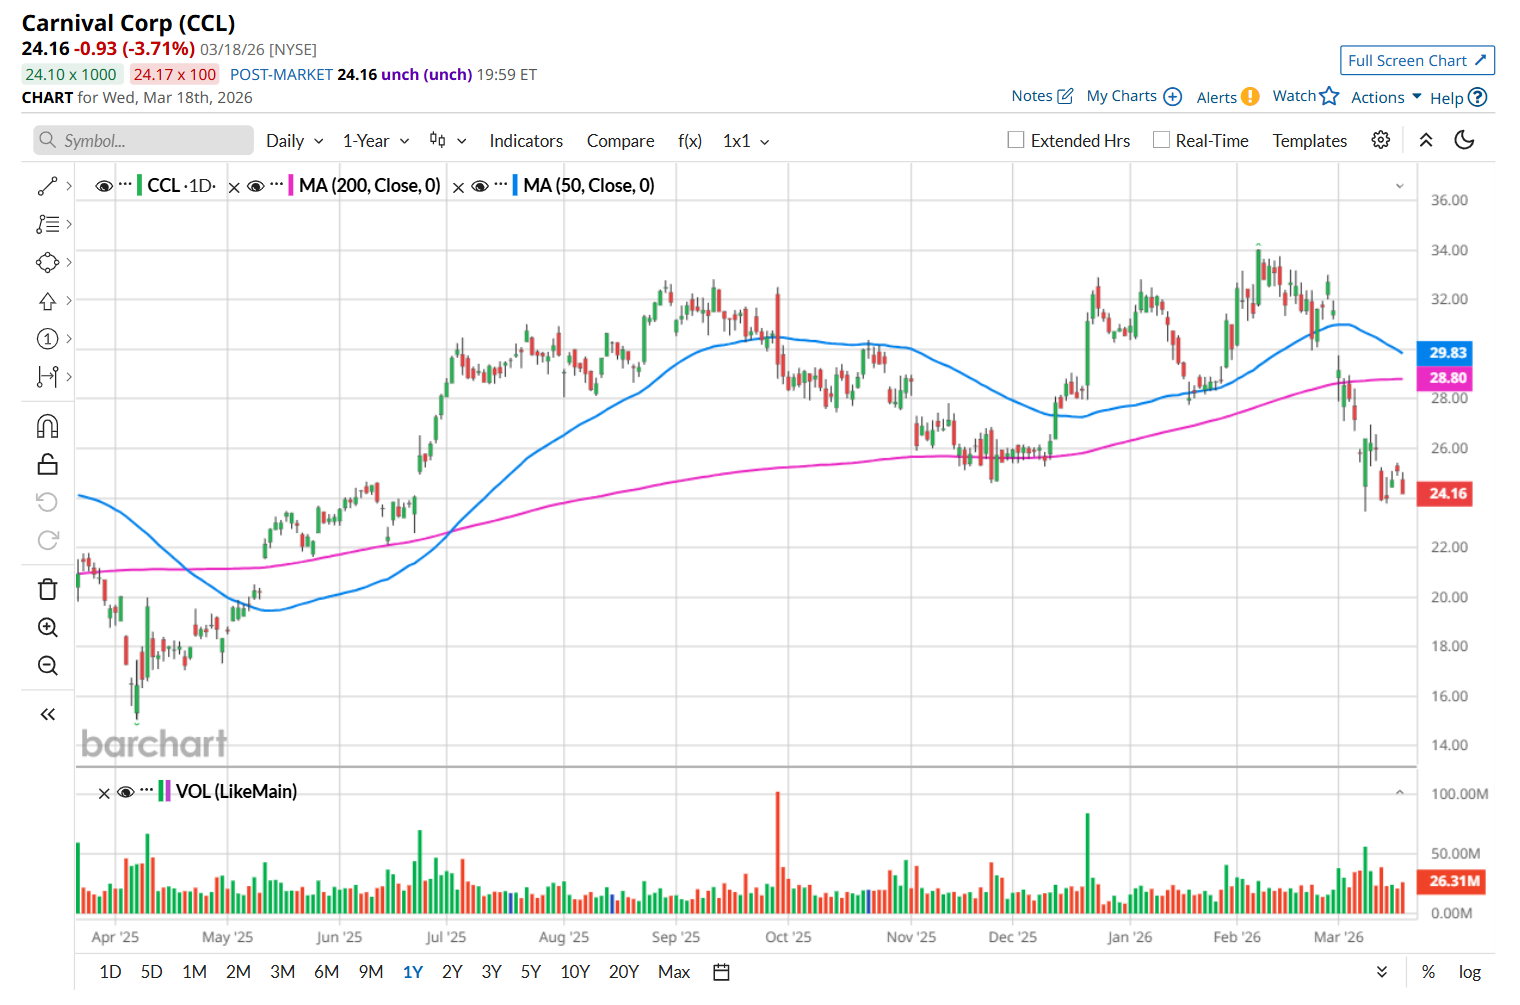
This cruise company has slipped 29% from its 52-week high of $34.03, reached on Feb. 6. Shares of CCL have declined 14.8% over the past three months, underperforming the Dow Jones Industrial Average’s ($DOWI3.6% drop during the same time frame.

www.barchart.com 

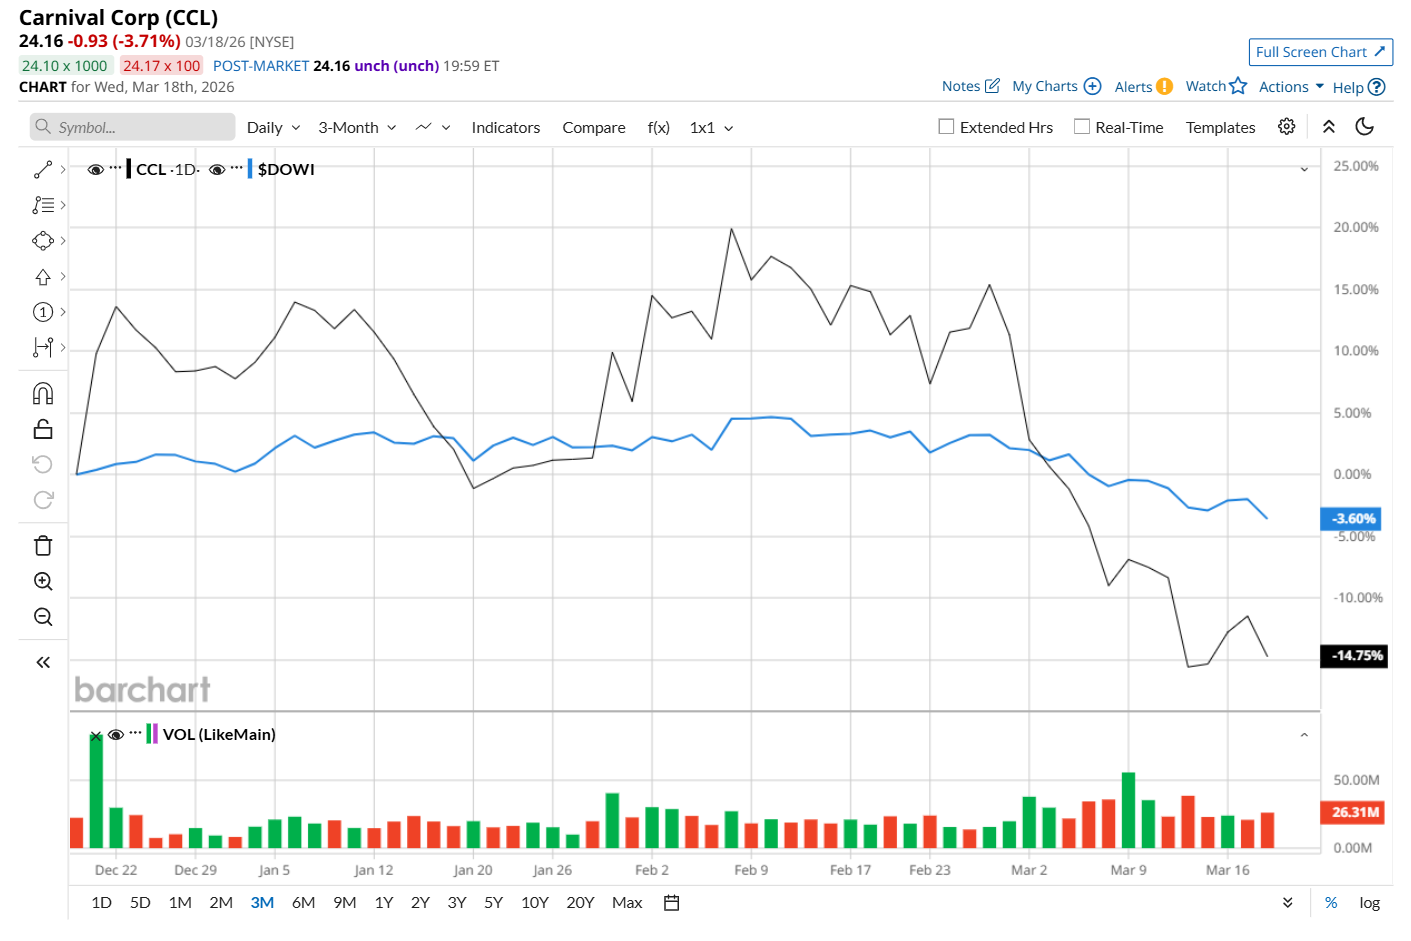
Moreover, on a YTD basis, shares of CCL are down 20.9%, compared to DOWI’s 3.8% fall. Nonetheless, in the longer term, CCL has soared 20.1% over the past 52 weeks, outpacing DOWI’s 11.2% uptick over the same time frame. 

To confirm its recent bearish trend, CCL has been trading below its 200-day moving average since early March and has remained below its 50-day moving average since late February. 

www.barchart.com

On Mar. 12, global equities declined as escalating tensions in the Middle East pushed crude oil prices sharply higher, with Brent crude surging toward $100–$115 per barrel. The spike in energy prices raised concerns about inflation and economic slowdown, increasing fears of stagflation. Ongoing uncertainty and volatility weighed on investor sentiment, particularly impacting rate-sensitive sectors like autos and consumer discretionary, where stocks such as CCL dropped 7.9%

CCL has trailed its rival, Royal Caribbean Cruises Ltd. (RCL), which soared 32.5% over the past 52 weeks and declined 3.4% on a YTD basis. 

Despite CCL’s recent underperformance, analysts remain highly optimistic about its prospects. The stock has a consensus rating of “Strong Buy” from the 25 analysts covering it, and the mean price target of $37.52 suggests a 55.3% premium to its current price levels. 


On the date of publication, Neharika Jain did not have (either directly or indirectly) positions in any of the securities mentioned in this article. All information and data in this article is solely for informational purposes. For more information please view the Barchart Disclosure Policy here.


More news from Barchart

Recent Quotes

View More
Symbol Price Change (%)
AMZN  209.87
+0.00 (0.00%)
AAPL  249.94
+0.00 (0.00%)
AMD  199.46
+0.00 (0.00%)
BAC  46.83
+0.00 (0.00%)
GOOG  306.30
+0.00 (0.00%)
META  615.68
+0.00 (0.00%)
MSFT  391.79
+0.00 (0.00%)
NVDA  180.40
+0.00 (0.00%)
ORCL  152.90
+0.00 (0.00%)
TSLA  392.78
+0.00 (0.00%)
Stock Quote API & Stock News API supplied by www.cloudquote.io
Quotes delayed at least 20 minutes.
By accessing this page, you agree to the Privacy Policy and Terms Of Service.


IntelligentValue Home
Close Window

DISCLAIMER

All content herein is issued solely for informational purposes and is not to be construed as an offer to sell or the solicitation of an offer to buy, nor should it be interpreted as a recommendation to buy, hold or sell (short or otherwise) any security.  All opinions, analyses, and information included herein are based on sources believed to be reliable, but no representation or warranty of any kind, expressed or implied, is made including but not limited to any representation or warranty concerning accuracy, completeness, correctness, timeliness or appropriateness. We undertake no obligation to update such opinions, analysis or information. You should independently verify all information contained on this website. Some information is based on analysis of past performance or hypothetical performance results, which have inherent limitations. We make no representation that any particular equity or strategy will or is likely to achieve profits or losses similar to those shown. Shareholders, employees, writers, contractors, and affiliates associated with ETFOptimize.com may have ownership positions in the securities that are mentioned. If you are not sure if ETFs, algorithmic investing, or a particular investment is right for you, you are urged to consult with a Registered Investment Advisor (RIA). Neither this website nor anyone associated with producing its content are Registered Investment Advisors, and no attempt is made herein to substitute for personalized, professional investment advice. Neither ETFOptimize.com, Global Alpha Investments, Inc., nor its employees, service providers, associates, or affiliates are responsible for any investment losses you may incur as a result of using the information provided herein. Remember that past investment returns may not be indicative of future returns.

Copyright © 1998-2017 ETFOptimize.com, a publication of Optimized Investments, Inc. All rights reserved.