With a market cap of $127.4 billion, Parker-Hannifin Corporation (PH) is a global manufacturer of motion and control technologies serving aerospace and defense, industrial equipment, transportation, energy, and HVAC and refrigeration markets across North America, Europe, Asia Pacific, and Latin America. Operating through its Diversified Industrial and Aerospace Systems segments, the company offers a broad portfolio of products including filtration, sealing, fluid conveyance, actuation, control, and thermal management solutions.
Companies valued at $10 billion or more are generally classified as “large-cap” stocks, and Parker-Hannifin fits this criterion perfectly. Headquartered in Cleveland, Ohio, the company sells its products primarily to original equipment manufacturers through distributors and direct sales channels.
Shares of the motion and control products maker have fallen 2.5% from its 52-week high of $1,034.96. Parker-Hannifin shares have surged 17.8% over the past three months, outperforming the broader Nasdaq Composite's ($NASX) 3.5% decline during the same period.
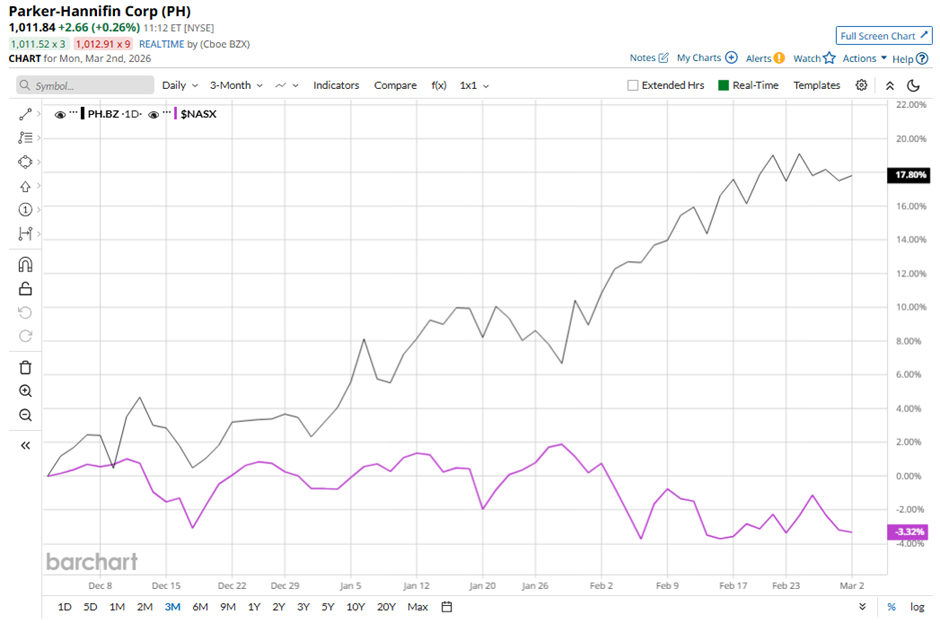
PH stock has gained 15.1% on a YTD basis, outpacing NASX's 2.8% decrease over the same period. Longer term, PH stock has surged 51.3% over the past 52 weeks, compared to NASX's 19.9% gain.
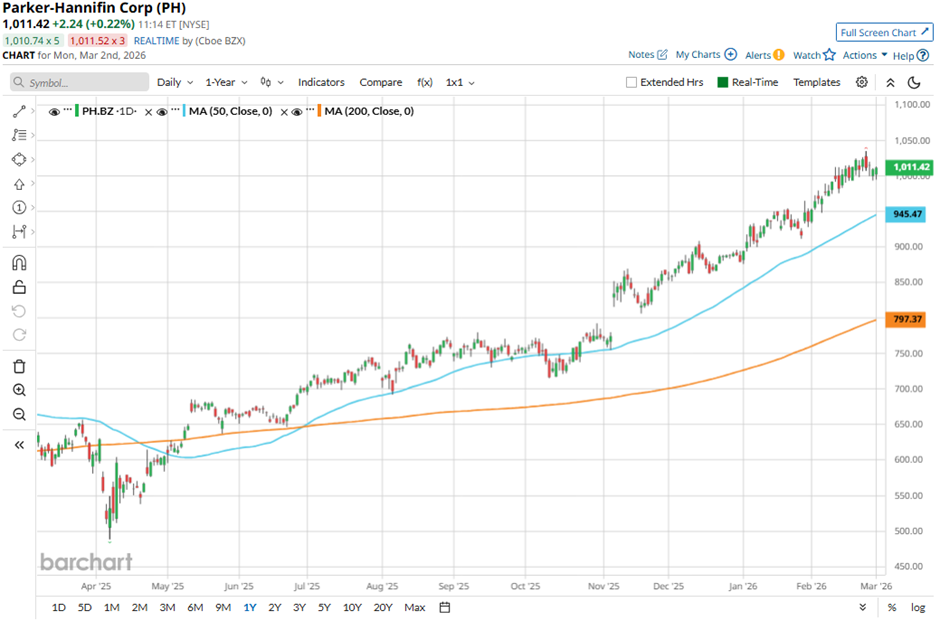
PH stock has consistently traded above both its 50-day and 200-day moving averages since May 2025.
Shares of Parker-Hannifin rose 3.5% on Jan.29 after the company reported record fiscal Q2 2026 sales of $5.2 billion (+9%), adjusted EPS of $7.65 (+17%), and a sharp improvement in profitability with adjusted segment operating margin rising to 27.1%. Investor sentiment was further boosted by strong order growth of 9%, including +14% in Aerospace, and a record backlog of $11.7 billion, signaling sustained demand, particularly from aerospace and defense markets.
The stock also gained on management’s upgraded full-year fiscal 2026 guidance, with adjusted EPS now expected in the range of $30.40 to $31 and higher sales and margin outlooks.
In contrast, rival Illinois Tool Works Inc. (ITW) has slightly outpaced PH stock on a YTD basis, with ITW shares gaining 17.6%. However, Illinois Tool Works shares have returned 9.7% over the past 52 weeks, lagging behind PH stock.
Due to PH's outperformance relative to NASX over the past year, analysts remain bullish about its prospects. Among the 24 analysts covering the stock, there is a consensus rating of “Strong Buy,” and the mean price target of $1,032.68 is a premium of 2.1% to current levels.
On the date of publication, Sohini Mondal did not have (either directly or indirectly) positions in any of the securities mentioned in this article. All information and data in this article is solely for informational purposes. For more information please view the Barchart Disclosure Policy here.
More news from Barchart