ETFOptimize | High-performance ETF-based Investment Strategies

Quantitative strategies, Wall Street-caliber research, and insightful market analysis since 1998.


ETFOptimize | HOME
Close Window

Is Stanley Black & Decker Stock Underperforming the Dow?

Stanley Black & Decker, Inc. (SWK) is a global industrial and consumer tools manufacturer known for its portfolio of leading brands in power tools, hand tools, storage, and engineered fastening solutions. The Connecticut-based company serves professional contractors, industrial customers, and retail consumers, making it a key player in construction, manufacturing, and home improvement markets.

Companies worth $10 billion or more are generally described as “large-cap stocks,” and SWK, with a market cap of $11.7 billion, perfectly fits that description. Its market leadership stems from its powerful brand portfolio, global distribution network, and scale advantages, enabling it to serve both professional and DIY markets effectively. Its strength is further reinforced by deep customer loyalty, broad product breadth, and innovation in cordless/battery-powered tools, positioning it as a dominant, go-to player across construction, industrial, and home improvement segments.


Despite its notable strength, SWK slipped 16.9% from its 52-week high of $93.37, achieved on Feb. 11. Over the past three months, SWK stock has declined 5.1%, compared to the Dow Jones Industrial Average’s ($DOWI) 4.4% decline during the same time frame.

www.barchart.com

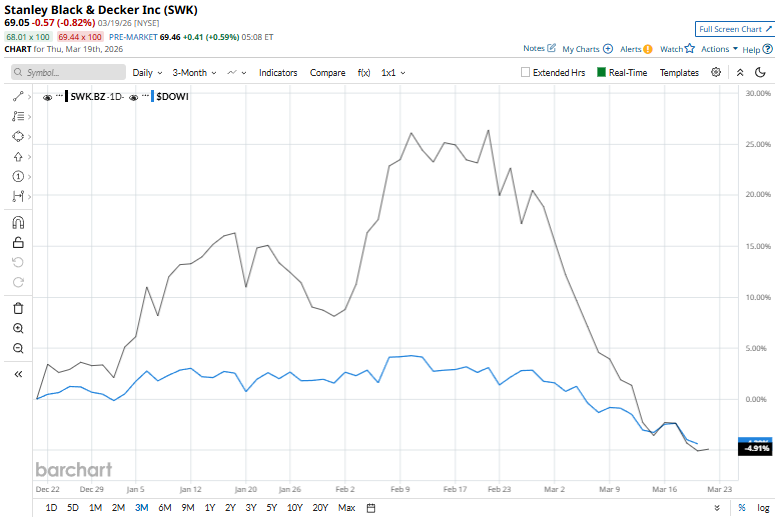
In the longer term, shares of SWK slumped 9.9% on a six-month basis and 16% over the past 52 weeks, underperforming DOWI’s six-month marginal dip and solid 9.7% returns over the last year.

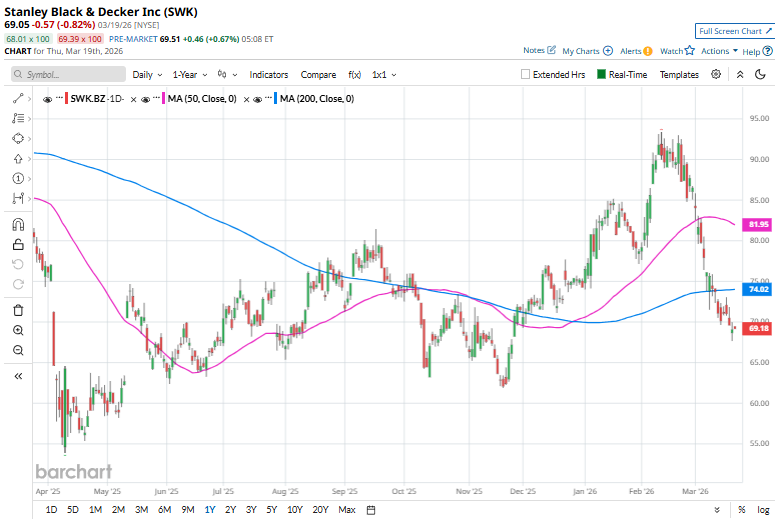
To confirm the recent bearish trend, SWK has been trading below its 50-day and 200-day moving averages since the start of this month. 

www.barchart.com

On Feb. 24, Stanley Black & Decker shares rose 2.3% after the company announced a first-quarter cash dividend of $0.83 per share. The dividend will be paid on March 24, 2026, to shareholders of record as of March 10, 2026, reinforcing the company’s ongoing commitment to returning capital to shareholders and signaling confidence in its cash flow stability.

SWK’s rival, Snap-on Incorporated (SNA), has surpassed the stock, with 7% gains on a six-month basis and an 8.4% uptick over the past 52 weeks.

Wall Street analysts are reasonably bullish on SWK’s prospects. The stock has a consensus “Moderate Buy” rating from the 17 analysts covering it, and the mean price target of $90.08 suggests a potential upside of 30.5% from current price levels.


On the date of publication, Kritika Sarmah did not have (either directly or indirectly) positions in any of the securities mentioned in this article. All information and data in this article is solely for informational purposes. For more information please view the Barchart Disclosure Policy here.


More news from Barchart

Recent Quotes

View More
Symbol Price Change (%)
AMZN  205.37
-3.39 (-1.62%)
AAPL  247.99
-0.97 (-0.39%)
AMD  201.33
-3.94 (-1.92%)
BAC  47.16
+0.15 (0.32%)
GOOG  298.79
-6.94 (-2.27%)
META  593.66
-13.04 (-2.15%)
MSFT  381.87
-7.15 (-1.84%)
NVDA  172.70
-5.86 (-3.28%)
ORCL  149.68
-5.84 (-3.76%)
TSLA  367.96
-12.34 (-3.24%)
Stock Quote API & Stock News API supplied by www.cloudquote.io
Quotes delayed at least 20 minutes.
By accessing this page, you agree to the Privacy Policy and Terms Of Service.


IntelligentValue Home
Close Window

DISCLAIMER

All content herein is issued solely for informational purposes and is not to be construed as an offer to sell or the solicitation of an offer to buy, nor should it be interpreted as a recommendation to buy, hold or sell (short or otherwise) any security.  All opinions, analyses, and information included herein are based on sources believed to be reliable, but no representation or warranty of any kind, expressed or implied, is made including but not limited to any representation or warranty concerning accuracy, completeness, correctness, timeliness or appropriateness. We undertake no obligation to update such opinions, analysis or information. You should independently verify all information contained on this website. Some information is based on analysis of past performance or hypothetical performance results, which have inherent limitations. We make no representation that any particular equity or strategy will or is likely to achieve profits or losses similar to those shown. Shareholders, employees, writers, contractors, and affiliates associated with ETFOptimize.com may have ownership positions in the securities that are mentioned. If you are not sure if ETFs, algorithmic investing, or a particular investment is right for you, you are urged to consult with a Registered Investment Advisor (RIA). Neither this website nor anyone associated with producing its content are Registered Investment Advisors, and no attempt is made herein to substitute for personalized, professional investment advice. Neither ETFOptimize.com, Global Alpha Investments, Inc., nor its employees, service providers, associates, or affiliates are responsible for any investment losses you may incur as a result of using the information provided herein. Remember that past investment returns may not be indicative of future returns.

Copyright © 1998-2017 ETFOptimize.com, a publication of Optimized Investments, Inc. All rights reserved.