Valued at $40.4 billion by market cap, EQT Corporation (EQT) is the largest natural gas producer in the United States, focused on the exploration and production of natural gas in the Appalachian Basin, particularly the Marcellus and Utica shales. The Pittsburgh, Pennsylvania-based company operates a scale-driven, low-cost model, supported by its extensive resource base and vertically integrated midstream infrastructure, which enhances efficiency and margins.
Companies worth $10 billion or more are generally described as "large-cap stocks." EQT fits right into that category, with its market cap exceeding this threshold, reflecting its substantial size and influence in the energy sector.
EQT touched its 52-week high of $67.15 on Mar. 19 and is currently trading 3.7% below that peak. Additionally, EQT stock prices have gained 20.1% over the past three months, outperforming the broader Nasdaq Composite’s ($NASX) fall of 7.1% over the same time frame.
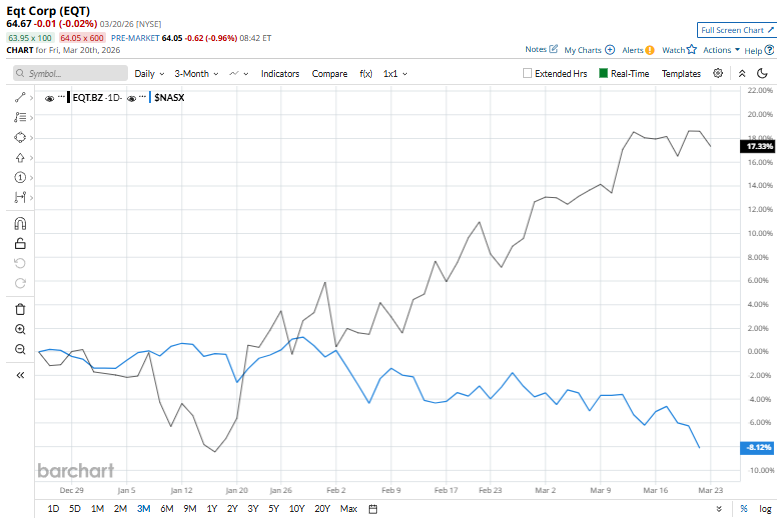
EQT stock prices have soared 31.5% on a six-month basis and 20.4% over the past 52 weeks, compared to NASX’s 4.4% fall over the past six months and 22.4% returns over the past year.
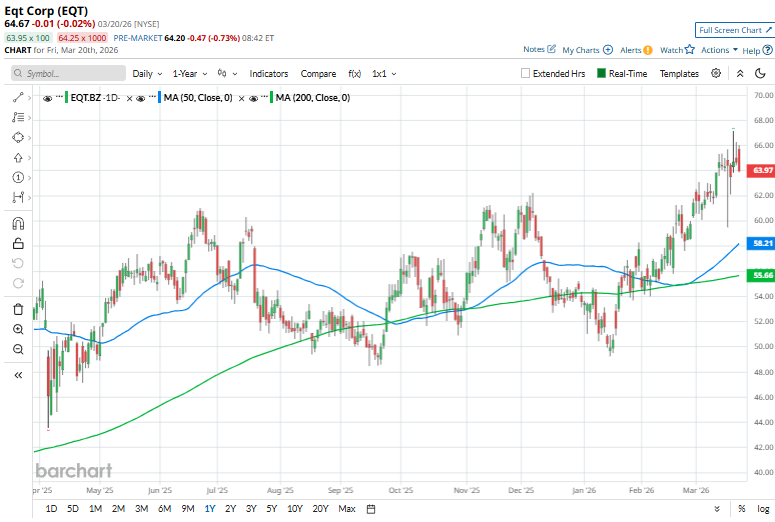
From a technical standpoint. EQT stock has climbed above its 50-day and 200-day moving averages early last month, indicating an uptrend.
On Mar. 10, EQT announced the launch of a cash tender offer to repurchase up to $1.15 billion of its outstanding senior notes across multiple maturities, with specific caps of $400 million for 2027 notes and $750 million for certain 2029 notes. The buyback will be executed based on priority levels across different debt tranches, allowing EQT to selectively retire debt. The move signals active balance sheet management and potential deleveraging, and the market responded positively, with the stock rising 3.2% in the following trading session.
Moreover, EQT has notably outperformed its peer, EOG Resources, Inc.’s (EOG) 18.5% surge over the past six months and 9.5% return over the past 52 weeks.
Among the 28 analysts covering the EQT stock, the consensus rating is a “Strong Buy.” Its mean price target of $66.73 suggests a 3.2% upside potential from current price levels.
On the date of publication, Kritika Sarmah did not have (either directly or indirectly) positions in any of the securities mentioned in this article. All information and data in this article is solely for informational purposes. For more information please view the Barchart Disclosure Policy here.
More news from Barchart
- As the Market Gives Us Lemons, This Nvidia Collar Might Just Taste Like Lemonade
- The Super Micro Computer Co-Founder Faces New Chip Smuggling Charges. Does That Actually Matter for SMCI Stock?
- A Plunge in Aluminum Futures Sends Alcoa Stock Below Its 50-Day Moving Average. Should You Buy the Dip?
- As Lawmakers Zero in on Nvidia-Groq Deal, Should You Be Worried About NVDA Stock?