Investors have been trading at-the-money and the slightly out-of-the-money Microsoft Corp (MSFT) call options today - a bullish signal. This is evident from three tranches highlighted in today's Barchart Unusual Stock Options Activity Report.
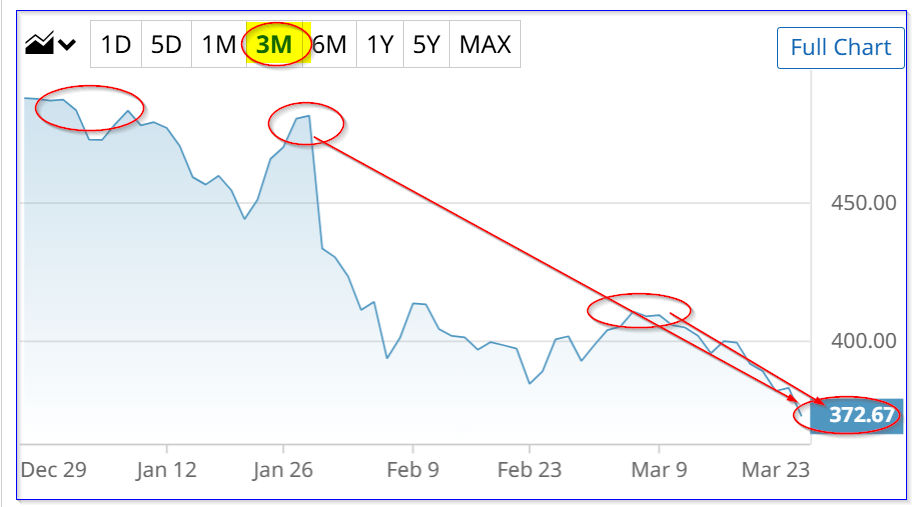
MSFT is at $372.97 in midday trading on Tuesday, March 24, off a recent peak of $410 on March 5, but well off its three-month peak of $487.48 on Dec. 30, 2025.
This was after Microsoft reported strong free cash flow (FCF) and FCF margins on Jan. 28 for its fiscal Q2, which ended Dec. 25. I discussed its results in my Jan. 30 Barchart article, “Microsoft's Free Cash Flow Crashes Due to High Capex - But Is MSFT Stock's Dip Overdone?”
MSFT Target Prices
I showed that, based on the company's capex spending plans, it could still generate $86 billion in FCF over the next 12 months. That was using analysts' revenue estimates, which have risen since then.
Based on that FCF estimate and a 45x FCF multiple, MSFT stock could have a market cap of $3.87 trillion. That's over $1 trillion more than its present market cap of $2.776 trillion.
That would give MSFT stock a price target that is 39.4% higher (i.e., $3.87 tr / $2.776 tr -1 = 1.394):
1.394 x $372.97 = $519.92 price target (PT)
In fact, using just a 40x multiple, the price target would be 23.9% higher (i.e., $3.44 trillion/$2.776 tr = 1.239), or :
1.239 x $372.97 price today = $462.11 PT
So, no wonder investors have been buying MSFT call options. They see MSFT stock as undervalued.
Other analysts tend to agree. For example, Yahoo! Finance reports that the average PT of 57 analysts is $594.52 per share, and Barchart's mean survey PT is $594.84. These are even higher than my PT based on its FCF estimates.
However, AnaChart.com, which tracks recent analyst write-ups, reports that 29 analysts have an average PT of $471.67. That's close to my PT, but still shows that MSFT is deeply undervalued.
Unusual MSFT Call Options Activity
This is seen in Barchart's Unusual Stock Options Activity Report today. It shows that three different tranches of MSFT call options have had heavy volume.
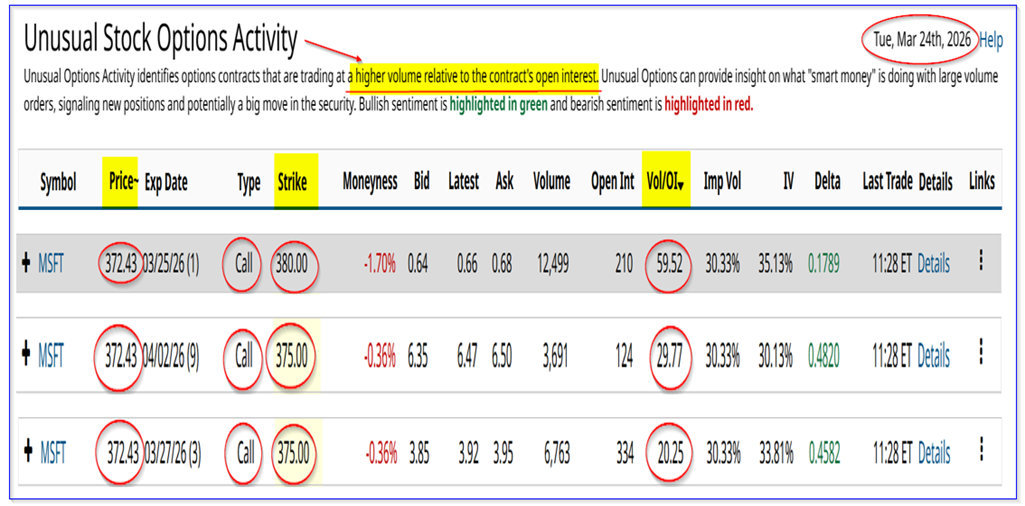
It shows that for the next 3 to 9 day expiration periods, investors have been trading the $375.00 and $370 strike price MSFT call options. The volume of this activity has been 20x to 60x the prior number of call options contracts outstanding. In other words, investors have been piling into these calls.
These strikes are slightly out-of-the-money (OTM) or at-the-money (ATM). That typically implies heavy call option buying activity.
In other words, investors see MSFT as too cheap here or are willing to either buy calls or sell covered calls.
For example, note that the midpoint premium for the $375.00 call option expiring on April 2, 9 days from now, is $6.47. That means investors buying these calls believe that MSFT will rise over $381.47, or +2.27% higher, in the next 9 days.
But, short sellers of these calls also make an immediate yield of 1.735% (i.e., $6.47/$372.97) by selling covered calls today. That is also a good return on investment, especially considering that they could also make capital gains:
1.735% + 2.27% capital gain = 4.0% potential return over 9 days
That shows why investors are piling into these MSFT call options today.
The bottom line is that MSFT stock looks pretty cheap here today, and investors are using call options to take advantage of its undervalued price.
On the date of publication, Mark R. Hake, CFA did not have (either directly or indirectly) positions in any of the securities mentioned in this article. All information and data in this article is solely for informational purposes. For more information please view the Barchart Disclosure Policy here.
More news from Barchart
- Investors are Piling into Microsoft Call Options - Unusual MSFT Options Activity Today
- Is ConocoPhillips Stock at a Peak? - Covered Call COP Plays Look Attractive
- This Disney Stock Trade Could Return 187% in Just 2 Months -- Try a Bear Put Spread
- Unusual Options Activity Flares in META and SMCI Stock: What to Watch Next