ETFOptimize | High-performance ETF-based Investment Strategies

Quantitative strategies, Wall Street-caliber research, and insightful market analysis since 1998.


ETFOptimize | HOME
Close Window

Is Clorox Company Stock Underperforming the Nasdaq?

With a market cap of $12.5 billion, The Clorox Company (CLX) is a consumer goods manufacturer headquartered in Oakland. The company is widely recognized for its diverse lineup of household cleaning, disinfecting, and lifestyle products, marketed under well-known brands such as Clorox, Pine-Sol, Burt’s Bees, Fresh Step, Kingsford, Liquid-Plumr, and Hidden Valley.

With a market cap above $10 billion, Clorox firmly qualifies as a large-cap stock, reflecting its scale, market presence, and leadership in the household and personal care space. Known for strong brand equity and consumer trust, the company continues to strengthen its position through broad distribution, ongoing product innovation, and deep retail partnerships that reinforce its competitive edge.


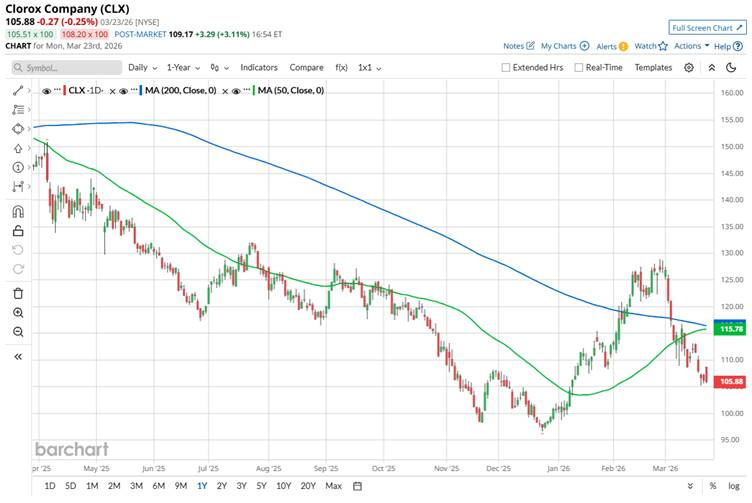
CLX has slipped 29.8% below its 52-week high of $150.84, reached in April 2025. Shares of the company have gained 8.7% over the past three months, considerably outperforming the Nasdaq Composite’s ($NASX6.9% slump during the same time frame.     

www.barchart.com

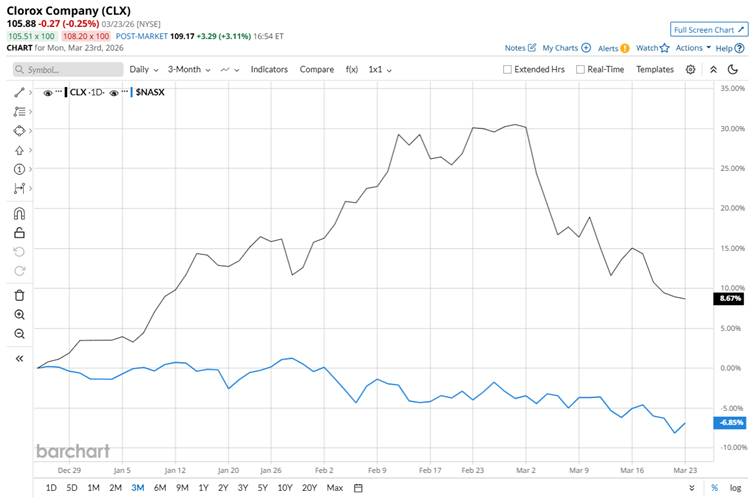
However, over the past six months, CLX is down 12.1%, compared to NASX’s 2.8% decline. In the longer term, CLX has fallen 26.9% over the past 52 weeks, notably lagging behind NASX’s 23.4% uptick over the same time frame.

To confirm its bearish trend, CLX has been mostly trading below its 50-day and 200-day moving averages over the past year, except for some momentum seen earlier in 2026, though it is again below the lines in March.

www.barchart.com

Shares of Clorox Company have declined over the past year amid weaker-than-expected earnings, driven by muted demand for cleaning products, volume declines, and consumers trading down to cheaper alternatives amid economic uncertainty. Also, disruptions from its ERP system transition and the lingering impact of earlier supply chain issues have hurt shipments and market share recovery. Higher manufacturing and logistics costs, along with intensified competition, have further pressured margins and dampened investor sentiment.

CLX has also lagged its rival, The Procter & Gamble Company (PG), which declined 13.6% over the past 52 weeks and 5.6% over the past six months.  

The stock has a consensus rating of “Hold” from the 18 analysts covering it, and the mean price target of $120.47 suggests a 13.8% premium to its current price levels. 


On the date of publication, Subhasree Kar did not have (either directly or indirectly) positions in any of the securities mentioned in this article. All information and data in this article is solely for informational purposes. For more information please view the Barchart Disclosure Policy here.


More news from Barchart

Recent Quotes

View More
Symbol Price Change (%)
AMZN  209.77
-0.80 (-0.38%)
AAPL  255.92
+0.29 (0.11%)
AMD  217.50
+7.29 (3.47%)
BAC  49.38
+0.11 (0.22%)
GOOG  294.46
-0.44 (-0.15%)
META  574.46
-4.77 (-0.82%)
MSFT  373.46
+4.09 (1.11%)
NVDA  177.39
+1.64 (0.93%)
ORCL  146.38
+1.15 (0.79%)
TSLA  360.59
-20.67 (-5.42%)
Stock Quote API & Stock News API supplied by www.cloudquote.io
Quotes delayed at least 20 minutes.
By accessing this page, you agree to the Privacy Policy and Terms Of Service.


IntelligentValue Home
Close Window

DISCLAIMER

All content herein is issued solely for informational purposes and is not to be construed as an offer to sell or the solicitation of an offer to buy, nor should it be interpreted as a recommendation to buy, hold or sell (short or otherwise) any security.  All opinions, analyses, and information included herein are based on sources believed to be reliable, but no representation or warranty of any kind, expressed or implied, is made including but not limited to any representation or warranty concerning accuracy, completeness, correctness, timeliness or appropriateness. We undertake no obligation to update such opinions, analysis or information. You should independently verify all information contained on this website. Some information is based on analysis of past performance or hypothetical performance results, which have inherent limitations. We make no representation that any particular equity or strategy will or is likely to achieve profits or losses similar to those shown. Shareholders, employees, writers, contractors, and affiliates associated with ETFOptimize.com may have ownership positions in the securities that are mentioned. If you are not sure if ETFs, algorithmic investing, or a particular investment is right for you, you are urged to consult with a Registered Investment Advisor (RIA). Neither this website nor anyone associated with producing its content are Registered Investment Advisors, and no attempt is made herein to substitute for personalized, professional investment advice. Neither ETFOptimize.com, Global Alpha Investments, Inc., nor its employees, service providers, associates, or affiliates are responsible for any investment losses you may incur as a result of using the information provided herein. Remember that past investment returns may not be indicative of future returns.

Copyright © 1998-2017 ETFOptimize.com, a publication of Optimized Investments, Inc. All rights reserved.