You might remember the gameshow “Name That Tune.” Contestants work to guess a song based on as few notes as possible. As it turns out, I’ve been doing something akin to that with an increasing chunk of my overall portfolio. And despite my own initial disbelief, the longer the stock market continues to trade like one big risk-on, risk-off investment, the more I believe that for many, two exchange-traded funds (ETFs) is all it takes.
Every investor should have a “core” and “anchor” that keeps them stable and allows them to explore with their true “risk capital.” The problem is that the S&P 500 Index ($SPX) has been considered that core. And it is acting very chaotically, with clearer signs each week that it is not going to bounce back as easily this time.
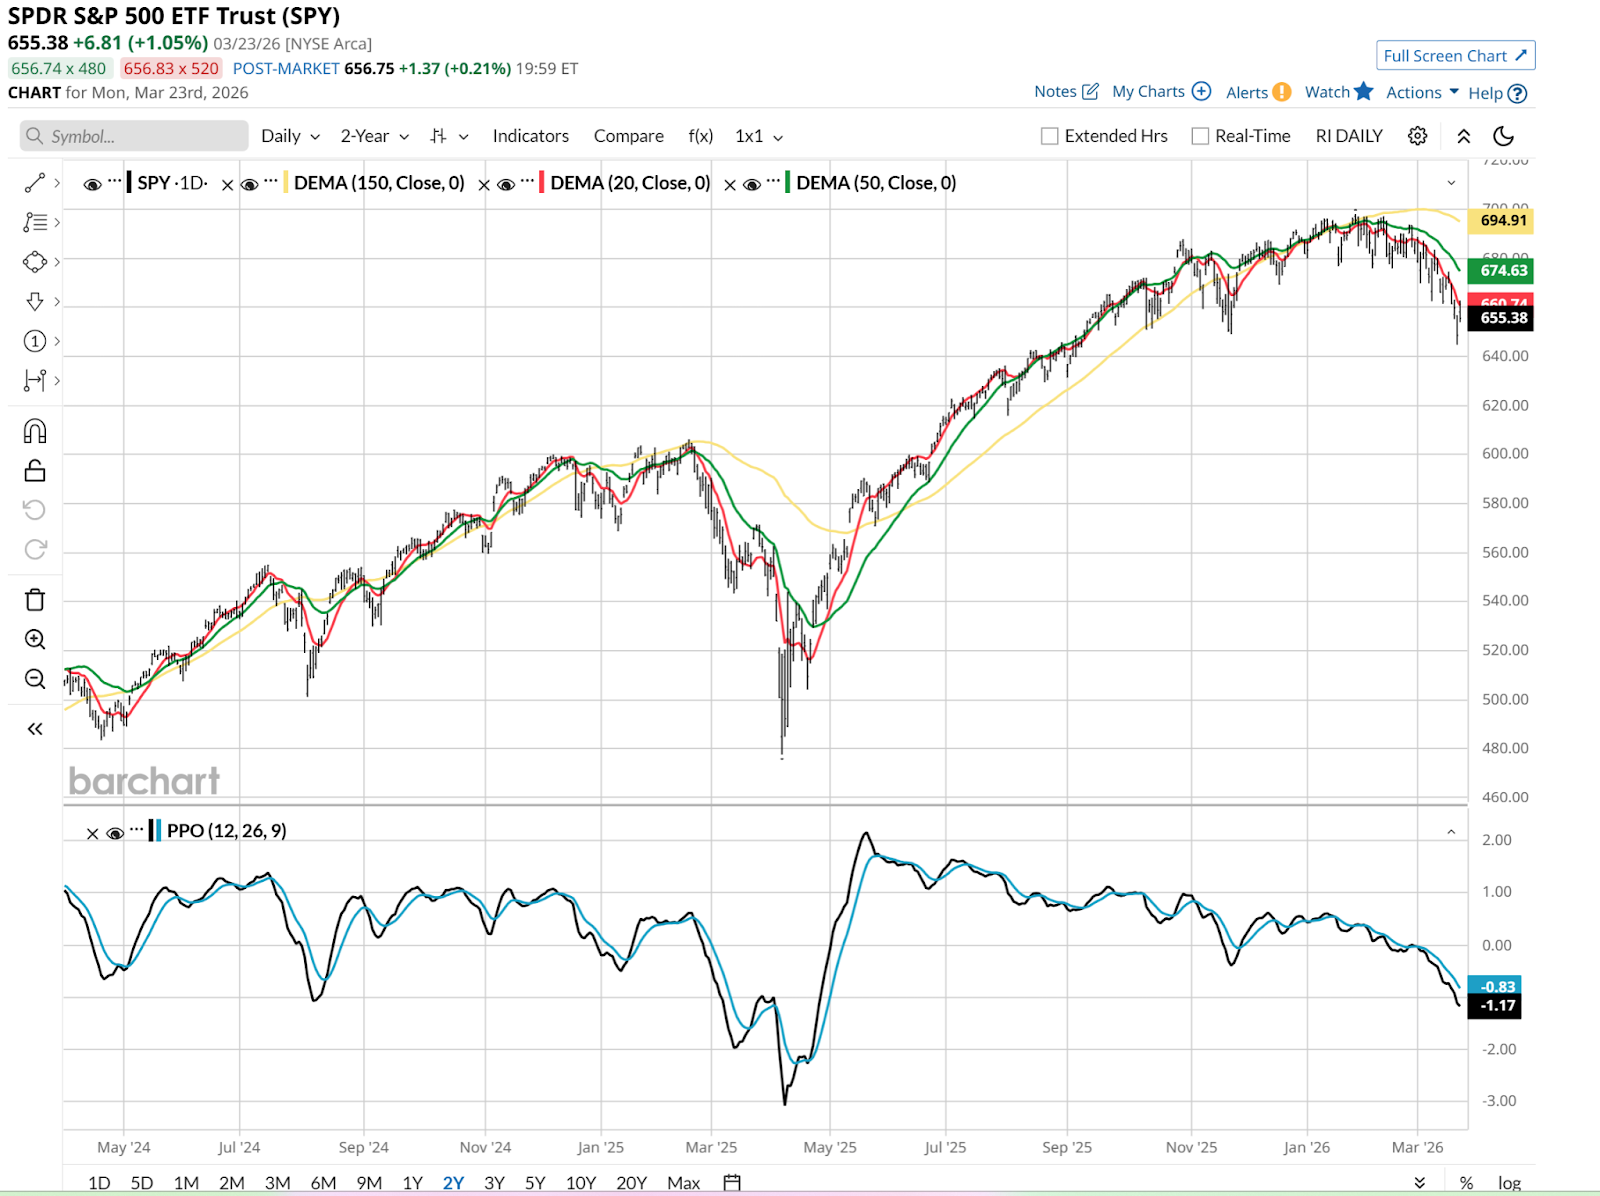
I’m a technician, and while charts are far from perfect, this one looks a lot like it is in a hole it can’t climb out of. That’s the S&P 500 ETF (SPY).
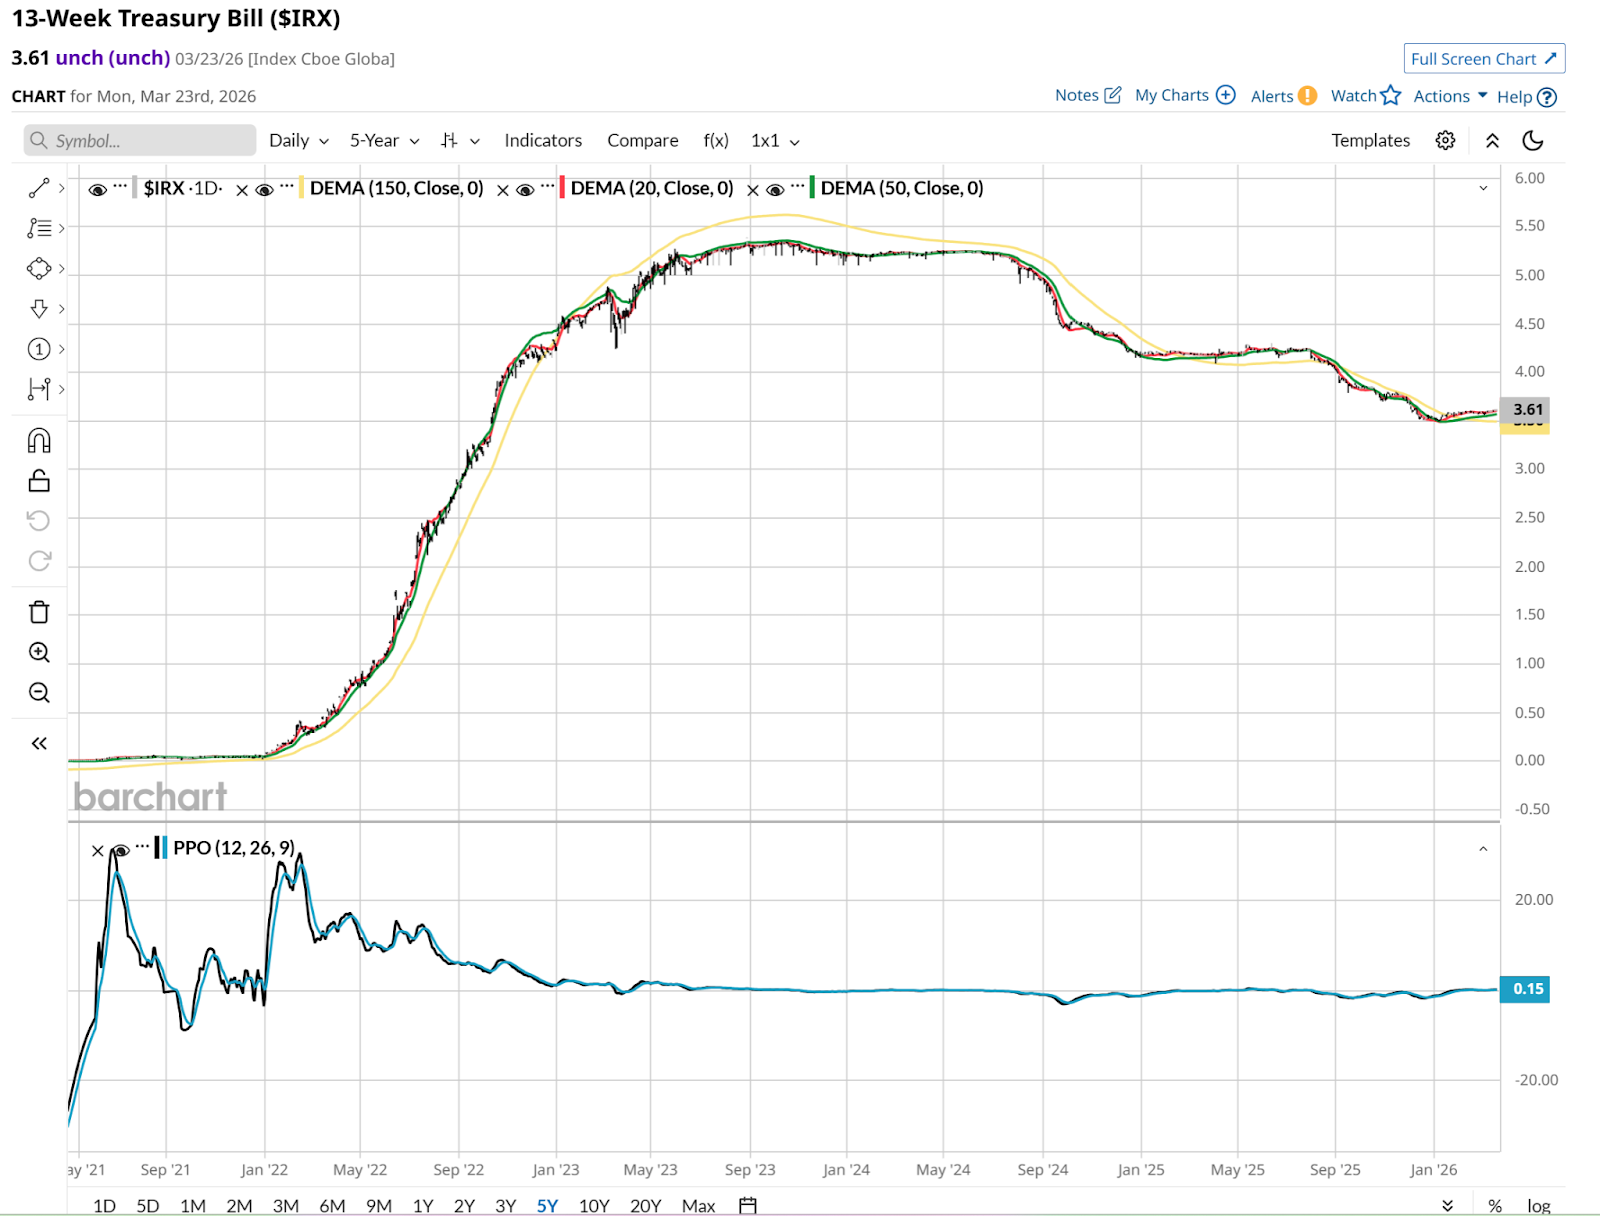
And here is the path of 3-month T-bills, which is also captured in the performance of the SPDR BBG 1-3 Month T-Bill ETF (BIL), one of several peer ETFs that are as close as ETF traders get to a money market fund.
While rates are well off their highs of 2024, they are well above where they spent the previous decade. And while a bit under 1% per quarter is not a great long-term return, it beats some of the financial beating stocks are taking.
I’ve written here in the past about the series of simple 2-ETF portfolios I’ve created. The “flagship” was SPY/BIL, stocks and T-bills. I invest in it using my ROAR Score method, applying that to SPY each week, then allocating the residual to BIL for safekeeping.
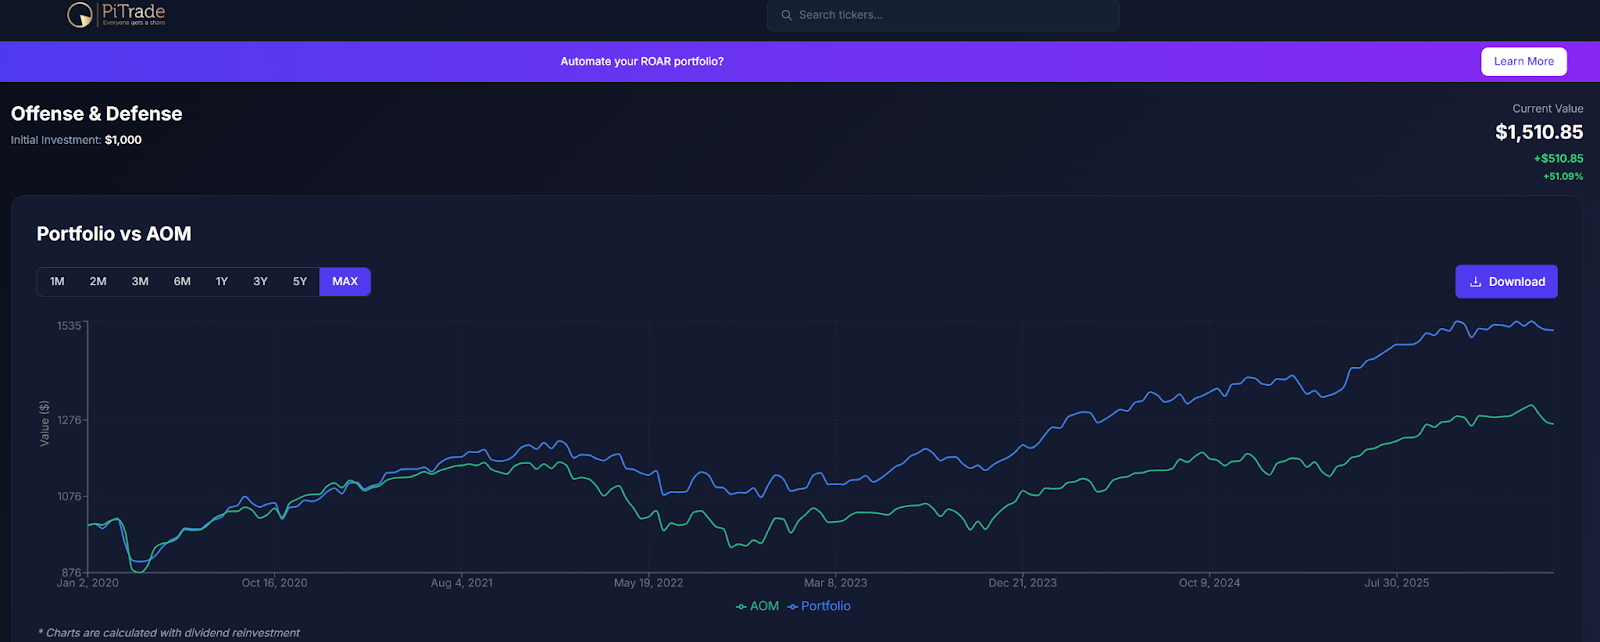
When I first started showing this to my newsletter subscribers at the start of this decade, I thought it would be a nice little indicator and a way to present the ROAR Score investing risk management system in a simple, portfolio-driven concept. Little did I know it would trounce traditional asset allocation ETFs by such a wide margin. Here it is in blue versus the iShares Core 40/60 Moderate Allocation ETF (AOM), which is a 40% stock/60% bond ETF mix. Not shown, SPY/BIL with a ROAR Score-driven allocation has also outpaced the iconic iShares Core 60/40 Balanced Allocation ETF (AOR), with significant downside protection.
A couple of simple statistics here have made me rethink just how complex investing in this era of inflation, index fund domination, algorithmic trading, artificial intelligence, and “TACO” really needs to be. Especially for inventors intimidated by the current markets who are just trying to stay afloat.
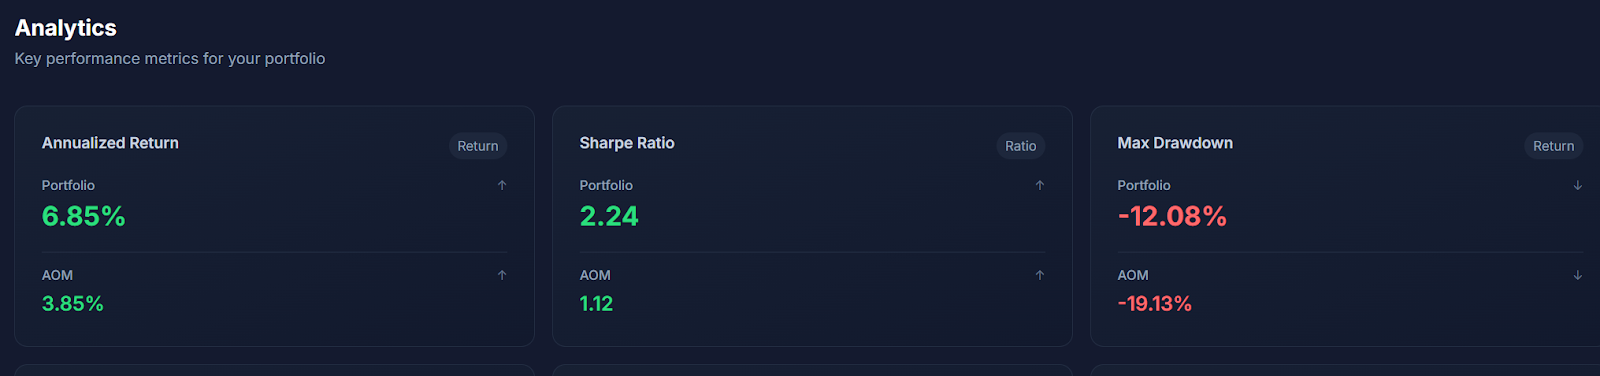
Those stats above tell me that there’s something elegant about simple, at least in today’s market. Over the more than 6-year period presented above, the 40/60 mix ETF has only managed a 3.85% annualized return. And that included a peak-to-trough drop of 19% at one point (during 2022’s twin stock/bond meltdown, similar to what’s being hinted at in this month’s activity).
By contrast, two ETFs and a ROAR, if you will, have produced a nearly 7% backtested return with a much lower worst-case drawdown. And a Sharpe Ratio (return per unit of risk) of exactly double that of AOM, the moderate index.
Why ‘Simple’ Works in Today’s Stock Market
Does this mean the future will repeat the past? Not necessarily. But it does tell me something is up. Or more to the point, something should be down.
What should be down? The amount of overthinking we do about this or that stock, this or that sector, earnings reports, Federal Reserve rumors, and of course, political drama.
For the past year, I’ve been telling everyone that I believed 80% of my investment work, even as a longtime professional, could center around SPY, BIL, and perhaps no more than another 8-10 ETFs.
Trading is different. I’ll trade anything. But for that core, that anchor, that formula to sleep well at night? It now seems obvious to me the better way to invest is simpler and more relaxed.
Rob Isbitts created the ROAR Score, based on his 40+ years of technical analysis experience. ROAR helps DIY investors manage risk and create their own portfolios. For Rob's written research, check out ETFYourself.com.
On the date of publication, Rob Isbitts did not have (either directly or indirectly) positions in any of the securities mentioned in this article. All information and data in this article is solely for informational purposes. For more information please view the Barchart Disclosure Policy here.
More news from Barchart