— Nearly All Asset Classes Flat to Negative for Quarter —
Institutional assets tracked by Wilshire Trust Universe Comparison Service® (Wilshire TUCS®) posted an all-plan median return of -0.06 percent for third quarter and 19.04 percent for the year ending September 30, 2021. Wilshire TUCS, a cooperative effort between Wilshire’s investment technology business and custodial organizations, is widely considered the definitive benchmark for U.S. institutional plan asset performance and allocation.
This press release features multimedia. View the full release here: https://www.businesswire.com/news/home/20211102005492/en/
(Graphic: Business Wire)
“After posting gangbuster returns over the past year, institutional portfolios settled into a narrow trading range during the third quarter,” said Jason Schwarz, President and Chief Operating Officer of Wilshire. “The upward return trend paused as investors weighed positive signs of continued strong economic demand against concerns over rising inflation, labor shortages, and supply chain disruptions,” Schwarz added.
U.S. equities, represented by the FT Wilshire 5000 Index℠, rose 0.14 percent third quarter and 32.35 percent for the year; meanwhile, international equities, represented by the MSCI AC World ex U.S., fell 2.99 percent third quarter and rose 23.91 percent for the year. U.S. bonds, represented by the Wilshire Bond Index℠, rose 0.23 percent second quarter and gained 1.50 percent gain for the one year.
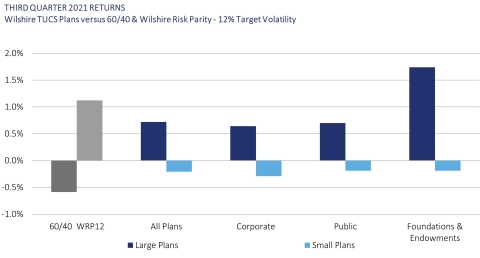
Across all plan types, quarterly median gains ranged from -0.16 to 1.74 percent for all and large foundations and endowments (assets above $500 million), respectively. One-year median returns ranged from 11.09 to 24.24 percent for large corporate funds (assets above $1 billion) and large foundations and endowments, respectively.
For the quarter, large and small plan types outperformed a -0.59 percent loss for the 60/40 portfolio. Medians for all plan groups, with the exception of large foundations and endowments, underperformed the 1.12 percent gain for the multi-asset Wilshire Risk Parity – 12% Target Volatility Index. Small plans underperformed large across all plan types in the third quarter, due mostly to greater fixed income exposure. Allocation trends continue to show significant exposure for large foundations and endowments to alternatives, with a median third quarter allocation of 43.75 percent. Median third quarter allocation to alternatives for large corporate and public funds was 16.51 and 14.25 percent, respectively.
Large plans (assets above $1 billion) overall posted 0.72 and 21.51 percent median gains for the quarter and year ending September 30, respectively; meanwhile, small plans (assets less than $1 billion) underperformed large for the quarter and one year, shedding -0.21 percent and gaining 18.38 percent, respectively.
Data and charts in this article are copyrighted and owned by Wilshire.
About Wilshire
Wilshire is a global provider of market-leading indexes, advanced analytics, and multi-asset investment solutions. A trusted partner to a diverse range of more than 500 institutional investors and financial intermediaries, our clients rely on us to improve investment outcomes for a better future.
Wilshire is headquartered in the United States with offices worldwide and advises on over $1.3 trillion in assets, $87 billion of which are assets under management.
More information on Wilshire can be found at www.wilshire.com.
View source version on businesswire.com: https://www.businesswire.com/news/home/20211102005492/en/
Contacts
Lisa Herbert
+1-310-899-5325 (O)
+1-310-728-5341 (C)
lherbert@wilshire.com


