Strong earnings and economic data, low volatility and continued reopenings help drive markets
The Investor Movement Index® (IMXSM) decreased .85 percent to 8.14 in April, down from its March score of 8.21. The IMX is TD Ameritrade’s proprietary, behavior-based index, aggregating Main Street investor positions and activity to measure what investors actually were doing and how they were positioned in the markets.
This press release features multimedia. View the full release here: https://www.businesswire.com/news/home/20210510005114/en/
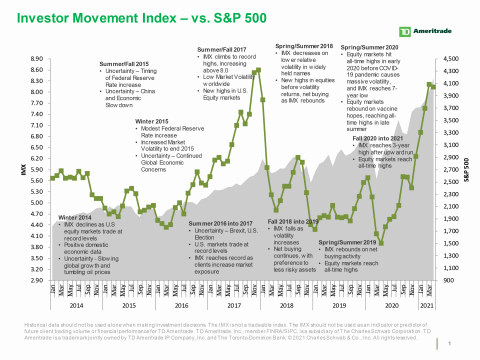
TD Ameritrade's IMX vs. S&P 500 (Graphic: TD Ameritrade)
The reading for the five-week period ending April 30, 2021 ranks “High” compared to historic averages.
“Despite an incredibly strong first quarter earnings season and all three major indices reaching record highs, stocks mostly treaded water in the latter half of April. Many clients used the last month to rebalance their portolios as they sold names as they reached historical peaks and bought names they believe will do well in the reopening trade,” said JJ Kinahan, chief market strategist, TD Ameritrade. “While data has been looking positive, we still have some lingering concerns including inflation. The question remains if the recent flow of positive earnings reports will give us another ‘leg up’ in the market or if inflation or other concerns will end this quiet period and lead to increased volatility.”
Equity markets continued their upward trend during the period, with all three major equity indices hitting all-time highs. The S&P 500 and Dow Jones Industrial Average increased 5.2 percent and 2.4 percent, respectively. The Tech sector posted the biggest gains with the Nasdaq Composite increasing 6.3 percent, propelled by recording earnings among many mega-cap tech companies. Market gains accelerated as the U.S. economy expanded rapidly in the first quarter, growing at a 6.4 percent annual rate. Retail sales jumped 9.8 percent, extending economists' projections of a consumer-led recovery this year, while jobless claims dropped sharply during the period and reached the lowest point since the beginning of the pandemic. The Federal Reserve also held interest rates near zero and announced plans to continue to support the economic recovery.
In April, TD Ameritrade clients were net buyers overall and net purchased equities and U.S. Stock ETFs. Some of the popular equity names bought during the period were:
- The Walt Disney Company (DIS)
- Viacom Inc. (VIAC)
- Advanced Micro Devices Inc. (AMD)
- QuantumScape Corp. (QS)
- Palantir Inc. (PLTR)
TD Ameritrade clients did find some names to sell on strength during the period, including:
- Johnson & Johnson (JNJ)
- Wells Fargo Inc. (WFC)
- Pfizer Inc. (PFE)
- United Parcel Service Inc. (UPS)
- Nvidia Corp. (NVDA)
About the IMX
The IMX value is calculated based on a complex proprietary formula. Each month, TD Ameritrade pulls a sample from its client base of funded accounts, which includes all accounts that completed a trade in the past month. The holdings and positions of this statistically significant sample are evaluated to calculate individual scores, and the median of those scores represents the monthly IMX.
For more information on the Investor Movement Index, including historical IMX data going back to January 2010; to view the full report from April 2021; or to sign up for future IMX news alerts, please visit www.tdameritrade.com/IMX. Additionally, TD Ameritrade clients can chart the IMX using the symbol $IMX in either the thinkorswim® or thinkorswim Mobile platforms.
Inclusion of specific security names in this commentary does not constitute a recommendation from TD Ameritrade to buy, sell, or hold. All investments involve risk including the possible loss of principal. Please consider all risks and objectives before investing.
Past performance of a security, strategy, or index is no guarantee of future results or investment success.
Historical data should not be used alone when making investment decisions. Please consult other sources of information and consider your individual financial position and goals before making an independent investment decision.
The IMX is not a tradable index. The IMX should not be used as an indicator or predictor of future client trading volume or financial performance for TD Ameritrade.
About TD Ameritrade
TD Ameritrade provides investing services and education to self-directed investors and registered investment advisors. A leader in U.S. retail trading, we leverage the latest in cutting edge technologies and one-on-one client care to help our clients stay on top of market trends. Learn more by visiting www.amtd.com.
Brokerage services provided by TD Ameritrade, Inc., member FINRA (www.FINRA.org) / SIPC (www.SIPC.org), a subsidiary of The Charles Schwab Corporation. TD Ameritrade is a trademark jointly owned by TD Ameritrade IP Company, Inc. and The Toronto-Dominion Bank. © 2021 Charles Schwab & Co. Inc. All rights reserved.
Source: TD Ameritrade, Inc.
View source version on businesswire.com: https://www.businesswire.com/news/home/20210510005114/en/
Contacts
At the Company
Alyson Nikulicz
Corporate Communications
(201) 755-4116
alyson.nikulicz@tdameritrade.com