Institutional assets tracked by Wilshire Trust Universe Comparison Service® (Wilshire TUCS®) posted an all plan median return of 5.50 and 25.43 percent for the second quarter and the year ending June 30, 2021, respectively. Wilshire TUCS, a cooperative effort between Wilshire’s analytics arm and investment technology foundation of the firm, and custodial organizations, is widely considered the definitive benchmark for U.S. institutional plan assets performance and allocation.
This press release features multimedia. View the full release here: https://www.businesswire.com/news/home/20210803005344/en/
(Graphic: Business Wire)
“Most plans benefited from sizable allocations to U.S. equities, which continued to outperform foreign equities, as U.S. economic recovery has outpaced foreign economies on a year-to-date basis,” said Jason Schwarz, President and Chief Operating Officer of Wilshire. “Fixed income allocations were also beneficial, as interest rates declined and corporate credit delivered strong performance,” Schwarz added.
Second quarter market was the best one-year return ending June for Wilshire TUCS plans since the one-year ending June in 1986.
U.S. equities, represented by the FT Wilshire 5000 Index℠, rose 8.42 and 44.24 percent for the second quarter and one year ending June; meanwhile, international equities, represented by the MSCI AC World ex U.S., rose 5.48 and 35.72 percent for the second quarter and one year ending June. U.S. bonds, represented by the Wilshire Bond Index℠, rose 2.89 for the second quarter to net a 2.54 percent gain for the one year ending June.
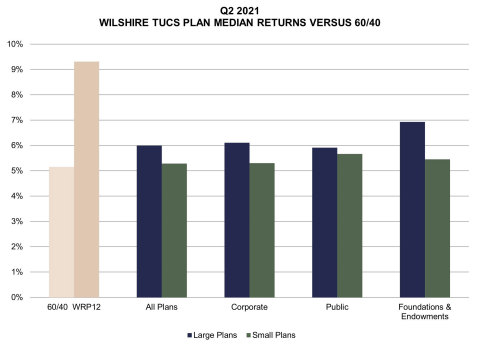
Across all plan types, quarterly median gains ranged from 5.48 to 6.93 percent, from corporate funds to large foundations and endowments (assets above $500 million), respectively. One-year median returns ranged from 13.99 to 33.20 percent, from large corporate funds (assets above $1 billion) to large foundations and endowments, respectively.
For the second quarter, large and small plan median returns outperformed the 60/40 portfolio, which gained 5.15 percent. Median returns for all plan groups underperformed the multi-asset Wilshire Risk Parity – 12% Target Volatility Index, which gained 9.31 percent. Small plan median returns underperformed large returns across all plan types due to greater fixed income exposure. Large foundations and endowments continued to show significant exposure to alternatives, with a median allocation of 42.30 percent for the quarter. Median allocation for large corporate and public funds to alternatives was 11.64 and 10.48 percent, respectively.
Large plans (assets above $1 billion) overall posted 5.99 and 26.15 percent median gains for the second quarter and one year ending June 30, respectively; meanwhile small plans (assets less than $1 billion) underperformed large for the second quarter and year with 5.29 and 25.10 percent median gains, respectively.
* Median allocations will not add up to 100 percent. No part of the chart may be re-produced.
Data and charts in this article are copyrighted and owned by Wilshire.
About Wilshire
Wilshire is a leading global investment technology and advisory company, dedicated to improving outcomes for investors worldwide. Founded in 1972, Wilshire advises on over $1.3 trillion in assets and manages $87 billion in assets. Specializing in innovative investment solutions, consulting services and multi-asset analytics, Wilshire serves more than 500 institutional and intermediary clients worldwide, delivering a high quality, coordinated platform of client-centric investment solutions that leverage the entire firm’s resources to the maximum benefit of our clients.
More information on Wilshire is available at www.wilshire.com
View source version on businesswire.com: https://www.businesswire.com/news/home/20210803005344/en/
Contacts
Lisa Herbert, Wilshire
+1-310-899-5325 (O)
+1-310-728-5341 (C)
lherbert@wilshire.com


