Most Asset Classes Negative for Quarter
Institutional assets tracked by Wilshire Trust Universe Comparison Service® (Wilshire TUCS®) posted an all-plan median return of -9.63 percent for the second quarter and -10.59 percent for the year ending June 30, 2022. Wilshire TUCS, a cooperative effort between Wilshire and custodial organizations, is widely considered the definitive benchmark for U.S. institutional plan assets performance and allocation.
This press release features multimedia. View the full release here: https://www.businesswire.com/news/home/20220809005401/en/
For the year, large and small plan groups outperformed the -13.42 percent loss for the 60/40 portfolio while mostly large plans outperformed the -11.41 percent loss for the multi-asset Wilshire Risk Parity – 12% Target Volatility Index. Large plans outperformed small across all plan types for the one-year. (Graphic: Business Wire)
“The second quarter of 2022 was historical but for all the wrong reasons. If you look back 50 years, you’ll be hard pressed to find another quarter where global equities were down by double-digits and investment grade bonds were down five-percent,” said Jason Schwarz, President of Wilshire. “All plan types were able to outperform a traditional 60/40 portfolio, particularly larger plans with higher allocations to alternative investments,” Schwarz added.
U.S. equities, represented by the FT Wilshire 5000 Index℠, fell -16.77 percent second quarter and -13.19 percent for the 12 months ending June; meanwhile, international equities, represented by the MSCI AC World ex U.S., fell -13.73 percent second quarter and -19.42 percent for the year. U.S. bonds, represented by the Wilshire Bond Index℠, fell -5.27 percent second quarter and -10.31 percent for the one-year.
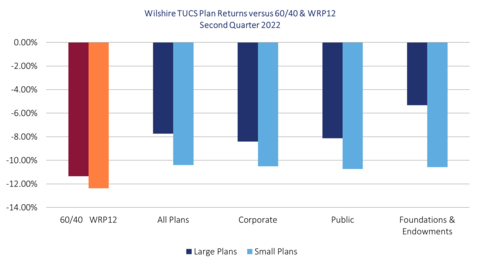
Across all plan types, quarterly median losses ranged from -5.33 to -10.74 percent for large foundation and endowment funds (assets above $500 million) and small public funds (assets below $1 billion), respectively. One-year median returns ranged from -1.15 to -12.70 percent for large foundation and endowment funds and small corporate funds (assets below $1 billion), respectively.
For the quarter, all plan medians outperformed the 60/40 portfolio loss of -11.36 percent. All plan medians also outperformed the -12.37 percent loss for the multi-asset Wilshire Risk Parity – 12% Target Volatility Index. Large foundation and endowment funds outperformed all other sizes and plan types in the second quarter due mostly to a larger exposure to U.S. alternatives. Allocation trends continue to show significant exposure for large foundations and endowments to alternatives, with a median second quarter allocation of 56.06 percent. Large corporate and public funds had median first quarter allocations to alternatives of 22.10 and 20.75 percent respectively.
For the year, large and small plan groups outperformed the -13.42 percent loss for the 60/40 portfolio while mostly large plans outperformed the -11.41 percent loss for the multi-asset Wilshire Risk Parity – 12% Target Volatility Index. Large plans outperformed small across all plan types for the one-year.
Large plans (assets above $1 billion) overall posted losses of -7.73 percent for the quarter and -7.25 percent for the year ending June 30, 2022; meanwhile small plans (assets less than $1 billion) underperformed large for the quarter and the year with returns of -10.40 and -12.07 percent, respectively.
About Wilshire
Wilshire is a global provider of market-leading indexes, advanced analytics, and multi-asset investment solutions. A trusted partner to a diverse range of more than 500 institutional investors and financial advisors and intermediaries, our clients rely on us to improve investment outcomes for a better future. Wilshire is headquartered in the United States with offices worldwide and advises on over $1.3 trillion in assets, $93 billion of which are assets under management.
More information on Wilshire can be found at www.wilshire.com.
Follow us on Twitter: @WilshireAssoc
View source version on businesswire.com: https://www.businesswire.com/news/home/20220809005401/en/
Contacts
Amy Bradford
abradford@wilshire.com
M +1 805 256 5674


