JetBlue Airways, Delta Air Lines and Southwest Airlines Rank Highest in Respective Segments
A combination of soaring demand, limited supply and surging airfares have helped airlines book record revenues during the past two quarters, but this golden age of enhanced revenues is coming at the expense of customer satisfaction. According to the J.D. Power 2023 North America Airline Satisfaction Study,SM released today, customer satisfaction with major airlines is down significantly for a second consecutive year, introducing the risk of possible brand damage if the current pattern of price hikes, staffing shortages and reduced routes continues.
This press release features multimedia. View the full release here: https://www.businesswire.com/news/home/20230510005026/en/
J.D. Power 2023 North America Airline Satisfaction Study (Graphic: Business Wire)
“If yield management were the only metric airlines needed to be successful in the long term, this would be a banner year for the industry because they are operating at peak economic efficiency,” said Michael Taylor, travel intelligence lead at J.D. Power. “From the customer perspective, however, that means planes are crowded, tickets are expensive and flight availability is constrained. While these drawbacks have not yet put a dent in leisure travel demand, if this trend continues, travelers will reach a breaking point and some airline brands may be damaged.”
Following are some of the key findings of the 2023 study:
- Overall passenger satisfaction declines, driven largely by cost of airfare: Overall passenger satisfaction is 791 (on a 1,000-point scale), down 7 points from a year ago. This is the second consecutive year of waning passenger satisfaction, following a 22-point decline in 2022 from 2021. The biggest factor driving this year’s decline in satisfaction is cost and fees, which has fallen 17 points from 2022.
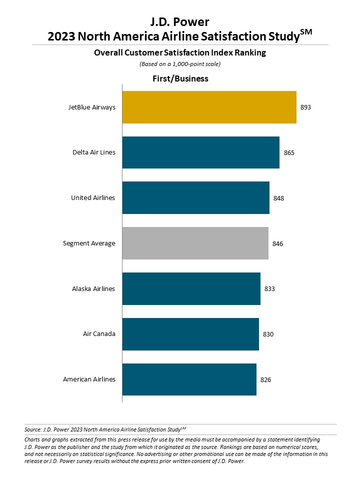
- First-class passengers buck the trend: While overall satisfaction is down, passengers in the first/business segment have had a decidedly more positive experience. Passenger satisfaction scores in this segment are up 9 points year over year. The gains are due in part to increases in food and beverage scores as many services were reinstated for upper class cabins in the post-pandemic period.
- Low-cost carriers feel the pinch: Annual declines in passenger satisfaction are most pronounced in the economy/basic economy segment where price-conscious passengers have found fewer airfare bargains this year. Satisfaction with cost and fees in the economy/basic economy segment is down 19 points from a year ago.
- One thing everyone can agree on: One of the few areas showing improvement across all segments this year is food and beverage, which is up 12 points overall from 2022.
Study Rankings
JetBlue Airways ranks highest in customer satisfaction in the first/business segment for a second consecutive year, with a score of 893. Delta Air Lines (865) ranks second and United Airlines (848) ranks third.
Delta Air Lines ranks highest in customer satisfaction in the premium economy segment with a score of 848. JetBlue Airways (840) ranks second and Alaska Airlines (823) ranks third.
Southwest Airlines ranks highest in customer satisfaction in the economy/basic economy segment for a second consecutive year, with a score of 827. Delta Air Lines (801) ranks second and JetBlue Airways (800) ranks third.
The North America Airline Satisfaction Study measures passenger satisfaction with airline carriers in North America based on performance in eight factors (in alphabetical order): aircraft; baggage; boarding; check-in; cost and fees; flight crew; in-flight services; and reservation. The study measures passenger satisfaction in three segments—first/business, premium economy and economy/basic economy—and is based on responses from 7,774 passengers. Passengers needed to have flown on a major North America airline within the past month of completing a survey. The study was fielded from March 2022 through March 2023.
For more information about the North America Airline Satisfaction Study, visit https://www.jdpower.com/business/resource/jd-power-north-america-airline-satisfaction-study.
See the online press release at http://www.jdpower.com/pr-id/2023041.
About J.D. Power
J.D. Power is a global leader in consumer insights, advisory services and data and analytics. A pioneer in the use of big data, artificial intelligence (AI) and algorithmic modeling capabilities to understand consumer behavior, J.D. Power has been delivering incisive industry intelligence on customer interactions with brands and products for more than 50 years. The world's leading businesses across major industries rely on J.D. Power to guide their customer-facing strategies.
J.D. Power has offices in North America, Europe and Asia Pacific. To learn more about the company’s business offerings, visit JDPower.com/business. The J.D. Power auto shopping tool can be found at JDPower.com.
About J.D. Power and Advertising/Promotional Rules: www.jdpower.com/business/about-us/press-release-info
View source version on businesswire.com: https://www.businesswire.com/news/home/20230510005026/en/
Contacts
Geno Effler, J.D. Power; West Coast; 714-621-6224; media.relations@jdpa.com
John Roderick; East Coast; 631-584-2200; john@jroderick.com