Truckload freight volumes and spot rates held firm in June while contract rates fell to their lowest points in almost two years, according to DAT Freight & Analytics, operators of the industry’s largest online freight marketplace and DAT iQ data analytics service.
This press release features multimedia. View the full release here: https://www.businesswire.com/news/home/20230717037287/en/
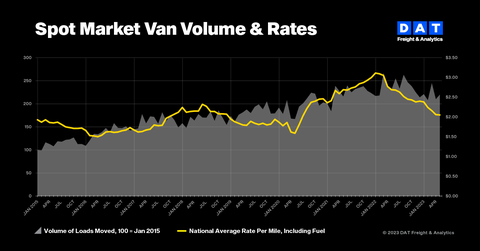
June signals that spot rates have hit bottom (Graphic: DAT Freight & Analytics)
“The gap between spot and contract rates was the narrowest since April 2022,” said Ken Adamo, DAT Chief of Analytics. “Rates for van and refrigerated freight increased for the third straight month, and volumes were almost unchanged from May. These are signs that spot truckload prices have reached the bottom of the current freight cycle.”
The national benchmark contract rate for dry van freight has not increased for 12 consecutive months. At $2.58 per mile, the rate was 70 cents lower than a year ago.
Volumes held steady in June
The DAT Truckload Volume Index (TVI), an indicator of loads moved during a given month, decreased marginally for van and refrigerated (“reefer”) freight and increased slightly for flatbed loads:
- Van TVI: 230, down 1% from May
- Reefer TVI: 167, down 3% from May
- Flatbed TVI: 267, up 2% from May
Van, reefer rates improved
On the spot market, the national benchmark rates for van and reefer freight rose while the flatbed rate declined compared to May:
- Spot van rate: $2.08 per mile, up 3 cents, the first increase in five months
- Spot reefer rate: $2.47 a mile, up 3 cents
- Spot flatbed rate: $2.61 a mile, down 4 cents
Van line haul rates averaged $1.65 a mile, up 4 cents compared to May, while reefer line haul rates averaged $2.01 a mile, up 5 cents. The flatbed line haul rate dipped 2 cents to $2.10 a mile. Line haul rates subtract an amount equal to an average fuel surcharge. Lower diesel prices in June pushed fuel surcharges to 17-month lows, averaging 43 cents a mile for van freight, 46 cents for reefers, and 51 cents for flatbeds.
Load-to-truck ratios reflected seasonal demand
Load-to-truck ratios reflect truckload supply and demand on the DAT One marketplace:
- The national average van load-to-truck ratio was 2.6, meaning there were 2.6 loads for every van posted to the DAT One marketplace last month. The ratio was 2.5 in May and 3.9 in June 2022.
- The reefer ratio averaged 3.8, up from 3.6 in May and down from 7.0 in June 2022.
- The flatbed ratio fell to 9.7, down from 11.7 in May and 37.6 in June 2022.
“Demand for truckload services typically slows at this time of year, but this could change quickly given the threat of strikes in the parcel and less-than-truckload sectors,” Adamo said. “Shippers are putting contingency plans in place and would look to freight brokers and carriers on the spot market to keep their line haul operations moving. Demand for trucks would jump, especially around Louisville, Memphis, Indianapolis, Dallas and other major parcel hubs.”
About the DAT Truckload Volume Index
The DAT Truckload Volume Index reflects the change in the number of loads with a pickup date during that month; the actual index number is normalized each month to accommodate any new data sources without distortion. A baseline of 100 equals the number of loads moved in January 2015, as recorded in DAT RateView, a truckload pricing database and analysis tool with rates paid on an average of 3 million loads per month.
Spot truckload rates are negotiated for each load and paid to the carrier by a freight broker. National average spot rates are derived from payments to carriers by freight brokers, third-party logistics providers and other transportation buyers for hauls of 250 miles or more with a pickup date during the month reported. DAT’s rate analysis is based on $150 billion in annualized freight transactions.
About DAT Freight & Analytics
DAT Freight & Analytics operates the largest truckload freight marketplace in North America. Shippers, transportation brokers, carriers, news organizations and industry analysts rely on DAT for market trends and data insights based on more than 400 million freight matches and a database of $150 billion in annual market transactions.
Founded in 1978, DAT is a business unit of Roper Technologies (Nasdaq: ROP), a constituent of the S&P 500 and Fortune 1000 indices.
View source version on businesswire.com: https://www.businesswire.com/news/home/20230717037287/en/
Contacts
Annabel Reeves
Corporate Communications, DAT Freight & Analytics
PR@dat.com / annabel.reeves@dat.com; 503-501-0143