Schwab clients were net buyers in April, finding several opportunities to increase exposure, notably in technology-related names
The Schwab Trading Activity Index™ (STAX) decreased to 48.87 in April, down from its score of 51.65 in March. The only index of its kind, the STAX is a proprietary, behavior-based index that analyzes retail investor stock positions and trading activity from Schwab’s millions of client accounts to illuminate what investors were actually doing and how they were positioned in the markets each month.
This press release features multimedia. View the full release here: https://www.businesswire.com/news/home/20240506263012/en/
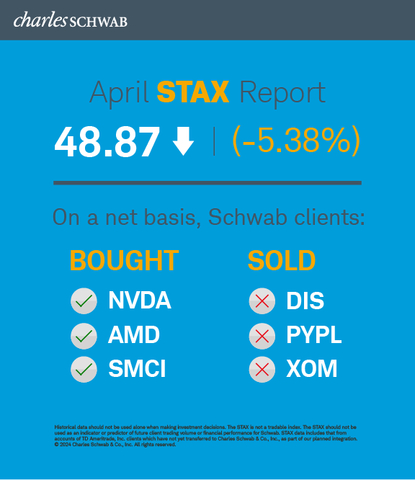
Schwab Trading Activity Index April 2024 (Graphic: Charles Schwab)
The reading for the four-week period ending April 26, 2024, ranks “moderate low” compared to historic averages as investment exposure decreased.
“The April STAX period was marked by volatility as major indices took a breather from a five-month winning streak and had their worst month since September, despite solid corporate earnings,” said Joe Mazzola, Head Trading & Derivatives Strategist at Charles Schwab. “While Schwab clients were net buyers of equities, the investor enthusiasm that characterized the March results began to wane in April, pushing down the STAX score for the month. Clients were more discerning with their purchases, preferring to gravitate towards companies with strong fundamentals, particularly those with compelling generative AI solutions. Those companies continue to rank near the top of our client buy lists.”
U.S. equity markets fell during the April STAX period and indices experienced several single-day losses of greater than 2% following disappointing economic data releases. The CBOE Volatility Index (VIX) spiked from 13.01 to 15.03, reflecting additional perceived downside risks to equities. On April 4, initial jobless claims came in at 221,000, slightly higher than the 214,000 expected, and the U.S. Bureau of Labor and Statistics’ Employment Situation Summary released on April 5 showed that nonfarm payrolls increased by 303,000 in March – significantly better than the 200,000 expected. The unemployment rate was little changed at 3.8%. The Consumer Price Index (CPI) rose by 0.4% for the month of March, bringing the 12-month increase to 3.5%, before seasonal adjustment. The Producer Price index (PPI) came in at 0.2%, corresponding to a 12-month rise of 2.1% versus economists’ projections of 2.3%. U.S. Retail Sales for March increased 0.7% from the previous month, versus an expected increase of just 0.3%.
On April 3, U.S. Federal Reserve Chairman Jerome Powell commented that core inflation stood at 2.8% versus 4.8% one year earlier. On April 25, Core Personal Consumption Expenditures (PCE) were reported at 3.7% versus expectations of 3.4%. The S&P 500 rose 0.22% during the April STAX period and closed slightly lower for the full month. The Nasdaq Composite fell 2.8% to close the period at 15,927.90 and the Dow Jones Industrial Average fell 3.9% during the period to close at 38,239.66. The 10-year Treasury yield also rose by a sharp 11.01% to close the period at 4.669. The U.S. Dollar Index rose slightly, closing at 105.41, and June Crude Oil futures rose by 0.82% to close the April STAX period at $83.85.
Popular names bought by Schwab clients during the period included:
- NVIDIA Corp. (NVDA)
- Advanced Micro Devices Inc. (AMD)
- Super Micro Computer Inc. (SMCI)
- Amazon.com Inc. (AMZN)
- Microsoft Corp. (MSFT)
Names net sold by Schwab clients during the period included:
- Walt Disney Co. (DIS)
- PayPal Holdings Inc. (PYPL)
- Exxon Mobil Corp. (XOM)
- Devon Energy Corp. (DVN)
- Occidental Petroleum Corp. (OXY)
About the STAX
The STAX value is calculated based on a complex proprietary formula. Each month, Schwab pulls a sample from its client base of millions of funded accounts, which includes accounts that completed a trade in the past month. The holdings and positions of this statistically significant sample are evaluated to calculate individual scores, and the median of those scores represents the monthly STAX.
For more information on the Schwab Trading Activity Index, please visit www.schwab.com/investment-research/stax. Additionally, Schwab clients can chart the STAX using the symbol $STAX in either the thinkorswim® or thinkorswim Mobile platforms.
Investing involves risk, including loss of principal. Past performance is no guarantee of future results.
Content intended for educational/informational purposes only. Not investment advice, or a recommendation of any security, strategy, or account type.
Historical data should not be used alone when making investment decisions. Please consult other sources of information and consider your individual financial position and goals before making an independent investment decision.
The STAX is not a tradable index. The STAX should not be used as an indicator or predictor of future client trading volume or financial performance for Schwab. STAX data includes that from accounts of TD Ameritrade, Inc. clients which have not yet transferred to Charles Schwab & Co., Inc., as part of our planned integration.
TD Ameritrade, Inc., member FINRA/SIPC, a subsidiary of The Charles Schwab Corporation.
About Charles Schwab
At Charles Schwab, we believe in the power of investing to help individuals create a better tomorrow. We have a history of challenging the status quo in our industry, innovating in ways that benefit investors and the advisors and employers who serve them, and championing our clients’ goals with passion and integrity.
More information is available at aboutschwab.com. Follow us on X, Facebook, YouTube, and LinkedIn.
0524-0Z61
View source version on businesswire.com: https://www.businesswire.com/news/home/20240506263012/en/
Contacts
At the Company
Margaret Farrell
Director, Corporate Communications
(203) 434-2240
margaret.farrell@schwab.com