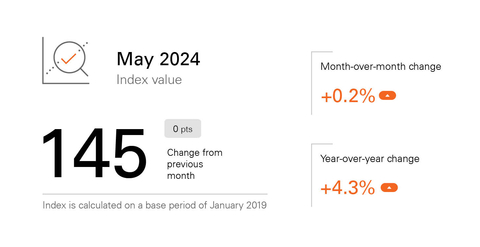
Fiserv Small Business Index holds steady at 145
Small business sales grew 4.3% year-over-year, and 0.2% month-over-month
Fiserv, Inc. (NYSE: FI), a leading global provider of payments and financial services technology, has published the Fiserv Small Business Index™ for May 2024. The Fiserv Small Business Index is an indicator of the performance of small businesses in the United States at national, state, and industry levels.
This press release features multimedia. View the full release here: https://www.businesswire.com/news/home/20240605948523/en/
May 2024 Fiserv Small Business Index (Graphic: Business Wire)
“Small businesses are a bellwether of the U.S. economy,” said Jennifer LaClair, Head of Merchant Solutions at Fiserv. “The Fiserv Small Business Index provides insight into this critical ecosystem well ahead of other economic indicators, and the most recent index shows that consumers continue to spend at a healthy, though slightly slower, pace.”
Nationally, the seasonally adjusted Fiserv Small Business Index for May remained steady at 145. Small business sales grew 4.3% year-over-year, and 0.2% month-over-month. Foot traffic grew 5.2% year-over-year and declined 0.5% compared to April.
“Consumer spending recorded another uptick in May, though consumers are keeping a closer eye on their discretionary purchases,” said Prasanna Dhore, Chief Data Officer at Fiserv. “We’re also seeing a shift toward non-discretionary spending, as spending growth at grocery stores, for example, outpaced that at restaurants.”
Retail Spending Stalls in May as Discretionary Spending Continues to Slow
Nationally, small business retail spending was flat while transactions grew 0.7% month-over-month. Among all retail categories, Food & Beverage Retailers experienced the most significant spending expansion (+2.1%). Clothing (+0.3%), Sporting Goods (+0.2%), and Health/Personal Care (+0.2%) also delivered small gains over April. Other areas of Retail such as General Merchandise (-0.4%), Auto Parts (-0.9%), Building Materials (-1.1%), and Furniture (-1.9%), slipped in May, suggesting that consumers are curbing some of their discretionary spending.
As Restaurant Spending Slows, Grocery Grows
Consumers continue to seek a balance in food spending, given the significant share of wallet food purchases consume each month. Restaurant spending was up 4.1% year-over-year and grew slightly (+0.6%) from April. Restaurant foot traffic, however, decreased 1.2% compared to April, as consumers made more trips to Food & Beverage Retailers, including grocers, which saw foot traffic grow 8.4% year-over-year and 1.5% month-over-month.
Mixed Results Across Service Categories
Specialty Trade Contractors year-over-year growth slowed to 2.8%, compared to 4.0% growth in April, while month-over-month sales grew slightly (+0.9%). Seasonal demand delivered an uptick in this category for small project contractors, swimming pool servicers, and HVAC specialists. Professional, Scientific, and Technical Services saw a lively 13.5% increase in sales year-over-year, with a decline of 0.7% from April. Much of this was expected as the acute demands for April tax season services have relaxed. Truck Transportation led all service categories nationally, growing 4.0% month-over-month.
About the Fiserv Small Business Index™
The Fiserv Small Business Index is published during the first week of every month and differentiated by its direct aggregation of consumer spending activity within the U.S. small business ecosystem. Rather than relying on survey or sentiment data, the Fiserv Small Business Index is derived from point-of-sale transaction data, including card, cash, and check transactions in-store and online across approximately 2 million U.S. small businesses.
Benchmarked to 2019, the Fiserv Small Business Index provides a numeric value measuring consumer spending, with an accompanying transaction index measuring customer traffic. Through a simple interface, users can access data by region, state, and/or across business types categorized by the North American Industry Classification System (NAICS). Computing a monthly index for 16 sectors and 34 sub-sectors, the Fiserv Small Business Index provides a timely, reliable and consistent measure of small business performance even in industries where large businesses dominate.
To access the full Fiserv Small Business Index visit fiserv.com/FiservSmallBusinessIndex.
About Fiserv
Fiserv, Inc. (NYSE: FI), a Fortune 500 company, aspires to move money and information in a way that moves the world. As a global leader in payments and financial technology, the company helps clients achieve best-in-class results through a commitment to innovation and excellence in areas including account processing and digital banking solutions; card issuer processing and network services; payments; e-commerce; merchant acquiring and processing; and the Clover® cloud-based point-of-sale and business management platform. Fiserv is a member of the S&P 500® Index and has been recognized as one of Fortune® World’s Most Admired Companies™ for 9 of the last 10 years. Visit fiserv.com and follow on social media for more information and the latest company news.
FI-G
View source version on businesswire.com: https://www.businesswire.com/news/home/20240605948523/en/
Contacts
Media Relations:
Chase Wallace
Director, Communications
Fiserv, Inc.
+1 470-481-2555
chase.wallace@fiserv.com
Additional Contact:
Ann S. Cave
Vice President, External Communications
Fiserv, Inc.
+1 678-325-9435
ann.cave@fiserv.com