Schwab clients were net buyers in July, increasing their exposure to technology-related names associated with semiconductors, cloud computing and the Consumer Discretionary sector
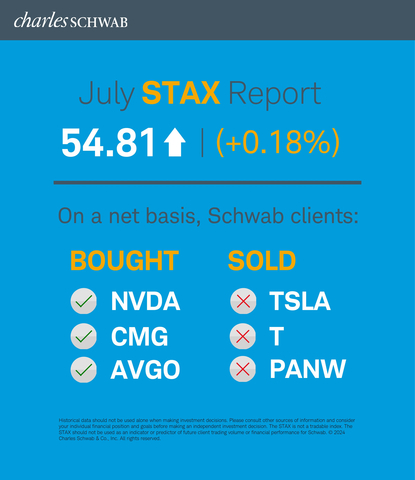
The Schwab Trading Activity Index™ (STAX) increased slightly to 54.81 in July, up from its score of 54.71 in June. The only index of its kind, the STAX is a proprietary, behavior-based index that analyzes retail investor stock positions and trading activity from Schwab’s millions of client accounts to illuminate what investors were actually doing and how they were positioned in the markets each month.
This press release features multimedia. View the full release here: https://www.businesswire.com/news/home/20240805350691/en/
Schwab Trading Activity Index July 2024 (Graphic: Charles Schwab)
The reading for the four-week period ending July 26, 2024, ranks “moderate” compared to historic averages.
“The July STAX period ended with U.S. equity markets appearing little changed – but looks can be deceiving. July saw significant volatility, attributable to both geopolitical and technical factors,” said Joe Mazzola, Head Trading & Derivatives Strategist at Charles Schwab. “Indices continued reaching new heights during the first half of the period, stretching valuations and investor expectations in advance of the second quarter earnings season. The second half of the month saw nearly all those gains relinquished, as volatility rose markedly. On a sector basis, clients bought most in Information Technology and Consumer Discretionary, while selling was most pronounced in Financials, Health Care, and Industrials.”
The CBOE Volatility Index (VIX) spiked by as much as 55% during the period and closed 31.75% higher at 16.39; levels not seen since April. Additionally, on July 24, both the Nasdaq Composite and S&P 500 logged their worst day since 2022, ending the S&P 500’s streak of over 360 trading days without a 2% sell-off.
On July 5, the U.S. Bureau of Labor and Statistics’ Employment Situation Summary showed nonfarm payrolls increased by 206,000 in June, beating the consensus estimate of 190,000. The unemployment rate edged higher once again to 4.1%. The Consumer Price Index (CPI) came in at 3.0%, just below expectations, while the Producer Price Index (PPI) of 0.2% was slightly higher than expected. On July 25, initial jobless claims of 235,000 were reported, reversing a recent trend of misses to the upside as compared to expectations. Core Personal Consumption Expenditures (PCE) were reported at 2.9% versus expectations of 2.7%, and Q2 GDP increased at an estimated annual rate of 2.8% versus real Q1 GDP of 1.4%; the increase was primarily driven by consumer spending and increases in business and inventory investments.
The 10-year Treasury yield spiked to as high as 4.49% intraday on July 1, and moderated to close the period at 4.2%. The U.S. Dollar Index fell by 1.46%, closing the period at 104.32, and front month Crude Oil Futures fell by 5.37% to close the July STAX period at $77.16 per barrel.
Popular names bought by Schwab clients during the period included:
- NVIDIA Corp. (NVDA)
- Chipotle Mexican Grill Inc. (CMG)
- Broadcom Inc. (AVGO)
- Amazon.com Inc. (AMZN)
- Alphabet Inc. (GOOG/GOOGL)
Names net sold by Schwab clients during the period included:
- Tesla Inc. (TSLA)
- AT&T Inc. (T)
- Palo Alto Networks Inc. (PANW)
- Exxon Mobil (XOM)
- Boeing (BA)
About the STAX
The STAX value is calculated based on a complex proprietary formula. Each month, Schwab pulls a sample from its client base of millions of funded accounts, which includes accounts that completed a trade in the past month. The holdings and positions of this statistically significant sample are evaluated to calculate individual scores, and the median of those scores represents the monthly STAX.
For more information on the Schwab Trading Activity Index, please visit www.schwab.com/investment-research/stax. Additionally, Schwab clients can chart the STAX using the symbol $STAX in either the thinkorswim® or thinkorswim Mobile platforms.
Investing involves risk, including loss of principal. Past performance is no guarantee of future results.
Content intended for educational/informational purposes only. Not investment advice, or a recommendation of any security, strategy, or account type.
Historical data should not be used alone when making investment decisions. Please consult other sources of information and consider your individual financial position and goals before making an independent investment decision.
The STAX is not a tradable index. The STAX should not be used as an indicator or predictor of future client trading volume or financial performance for Schwab.
About Charles Schwab
At Charles Schwab, we believe in the power of investing to help individuals create a better tomorrow. We have a history of challenging the status quo in our industry, innovating in ways that benefit investors and the advisors and employers who serve them, and championing our clients’ goals with passion and integrity.
More information is available at aboutschwab.com. Follow us on X, Facebook, YouTube, and LinkedIn.
0824-HA04
View source version on businesswire.com: https://www.businesswire.com/news/home/20240805350691/en/
Contacts
At the Company
Margaret Farrell
Director, Corporate Communications
(203) 434-2240
margaret.farrell@schwab.com