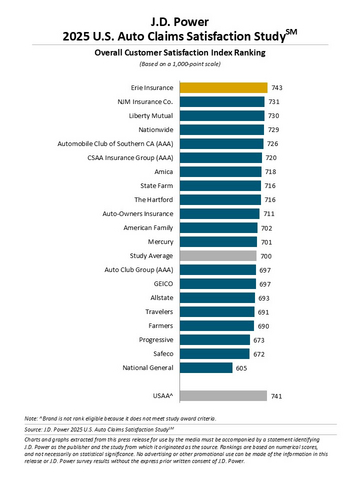
Erie Insurance Ranks Highest in Customer Satisfaction
Auto insurance rates have finally started to decline from the near-record highs of 2024, but customers are still feeling the sting of several years of sky-high insurance costs when it comes to their claims experience. According to the J.D. Power 2025 U.S. Auto Claims Satisfaction Study,SM released today, 26% of auto insurance customers now have deductibles of $1,000 or more, and 7% of auto insurance customers say they’ve avoided filing a claim for fear their rates could rise. As a result, overall satisfaction with the auto insurance claims process is largely flat at 700 (on a 1,000-point scale), rising just 3 points year over year.
This press release features multimedia. View the full release here: https://www.businesswire.com/news/home/20251028397623/en/
J.D. Power 2025 U.S. Auto Claims Satisfaction Study
“Auto insurance customers have made several adjustments to their policies in an effort to reduce costs—such as opting for higher deductibles, dropping rental coverage, avoiding filing claims and, in some cases, foregoing collision coverage altogether,” said Mark Garrett, director of global insurance intelligence at J.D. Power. “These changes have generally had a negative effect on consumers as they are spending more money when they have a claim. However, fewer claims being reported translates to faster cycle times and better customer support, resulting in a 9-point improvement in satisfaction among repairable vehicles.”
Following are some key findings of the 2025 study:
- Rate decreases slowly reaching customers: After auto insurance rates peaked near record highs in April 2024, they steadily declined during the remainder of the year and into 2025. Many insurers have filed for rate decreases in 2025, but many customers have yet to feel the effects of those decreases. In fact, 44% of auto insurance customers with a claim say they experienced a price increase in the past 12 months. Overall satisfaction among customers who experienced a rate increase is 650, which is 104 points lower than those who did not experience a rate increase.
- Coverage adjustments have negative effect: To reduce costs, many auto insurance customers have adjusted their policies by taking higher deductibles or foregoing rental coverage, but these cost-saving measures have a negative effect on customer satisfaction. The trend is most prominent among younger customers, with 43% of Gen Z1 auto insurance customers who had a price increase now carrying a deductible of $1,000 or more. Overall satisfaction scores among customers with deductibles of $1,000 or more who incurred rental costs are just 630, down 21 points from 2024.
- Repair cycle times improve, but safety tech creates challenges: The overall average cycle time for repairable vehicles in this year’s study is 19.3 days, down from 22.3 days a year ago, contributing to a 9-point improvement in satisfaction. However, that total cycle time is heavily influenced by the number of advanced driver assistance systems (ADAS) affected. Average cycle time for vehicles from model year 2015 and older with no ADAS features is 17.9 days, while average cycle time for newer vehicles (model year 2019 and newer) with three or more ADAS features is 21.5 days.
- Claim severity continues to grow: Total losses now account for 27% of claims, up from 24% a year ago and up from 16% in 2022. Satisfaction scores decline 9 points among customers who experienced a total loss, with just 58% saying the total loss valuation fully met their expectations. Smaller claims of $2,000 or less now represent just 20% of total claims, down from 21% in 2024 and 33% in 2022.
Study Ranking
Erie Insurance ranks highest in overall customer satisfaction with a score of 743. NJM Insurance Co. (731) ranks second and Liberty Mutual (730) ranks third.
The U.S. Auto Claims Satisfaction Study examines the auto claims experiences of customers from the largest insurance providers throughout the United States across eight dimensions (in order of importance): trust; fairness of settlement; people; time to settle claim; communication; ease of resolving claim; ease of starting claim; and digital channels. It is based on responses from 9,455 auto insurance customers who settled a claim within the past nine months prior to participating in the survey. It was fielded from September 2024 through August 2025. The study excludes claimants whose vehicle incurred only glass/windshield damage or was stolen, or who only filed a roadside assistance claim.
For more information about the U.S. Auto Claims Satisfaction Study, visit
https://www.jdpower.com/business/insurance/auto-claims-satisfaction-study.
To view the online press release, please visit http://www.jdpower.com/pr-id/2025139.
About J.D. Power
J.D. Power is a global leader in consumer insights, advisory services, and data and analytics. A pioneer in the use of big data, artificial intelligence (AI) and algorithmic modeling capabilities to understand consumer behavior, J.D. Power has been delivering incisive industry intelligence on customer interactions with brands and products for more than 55 years. The world's leading businesses across major industries rely on J.D. Power to guide their customer-facing strategies.
J.D. Power has offices in North America, Europe and Asia Pacific. To learn more about the company's business offerings, visit JDPower.com/business. The J.D. Power auto-shopping tool can be found at JDPower.com.
About J.D. Power and Advertising/Promotional Rules: www.jdpower.com/business/about-us/press-release-info
____________________ |
1 J.D. Power defines generational groups as Pre-Boomers (born before 1946); Boomers (1946-1964); Gen X (1965-1976); Gen Y (1977-1994); and Gen Z (1995-2006). Millennials (1982-1994) are a subset of Gen Y.
View source version on businesswire.com: https://www.businesswire.com/news/home/20251028397623/en/
Contacts
Media Relations Contacts
Joe LaMuraglia, J.D. Power; East Coast; 714-621-6224; media.relations@jdpa.com
John Roderick; East Coast; 631-584-2200; john@jroderick.com


