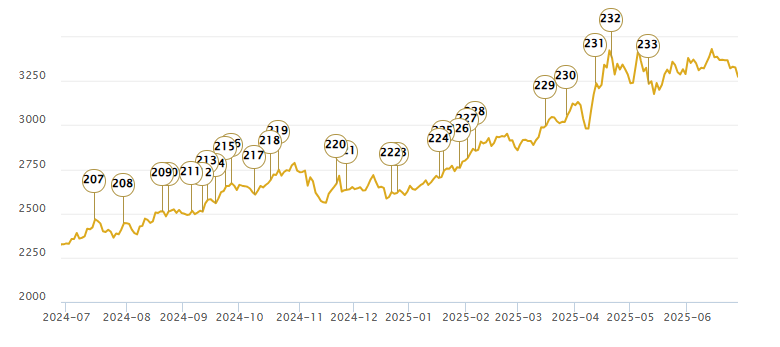
Spot gold prices gained strong upward momentum during the European trading session, hitting a record high of $3,237.66. They slightly adjusted back to the $3,220 area before the U.S. market opened, but remained in a strong range overall. Driven by the intensification of global trade tensions and the weakening of the U.S. dollar, gold once again demonstrated its value as a safe-haven asset.
Fundamental Analysis
The U.S. Dollar Index (DXY) has extended its broad-based decline and has now fallen below the 99.90 level, marking a three-year low. Ongoing concerns about both the global and U.S. economic outlook have intensified selling pressure on the dollar.
U.S inflation data for March came in below expectations, further strengthening market expectations that the Federal Reserve could begin cutting interest rates as early as June. The Consumer Price Index (CPI) rose 2.4% year-over-year, below the forecast of 2.6% and down from 2.8% in February. Core CPI, which excludes food and energy prices, increased 2.8% year-over-year, also below expectations. On a monthly basis, headline CPI fell by 0.1%, while core CPI edged up 0.1%.

Market Outlook
Bullish Perspective
In the short term, spot gold is expected to maintain its strength. The U.S. Dollar Index hitting a three-year low provides strong support for gold prices. Escalating global trade tensions have heightened risk-off sentiment in the markets, increasing gold’s appeal as a safe-haven asset. From a technical standpoint, gold is trading within an upward channel, with the $3,215 level serving as a key support. As long as prices remain above this level, gold may continue to test the $3,395–$3,535 range.
U.S. inflation data came in lower than expected, reinforcing market expectations that the Federal Reserve may implement multiple rate cuts this year. A rate-cutting cycle is typically favorable for gold, as it reduces the opportunity cost of holding non-yielding assets like gold. If expectations for further Fed rate cuts continue to build, gold prices may see additional upside, potentially challenging the psychological $3,600 level later this year.
Bearish Perspective
While bulls currently dominate in the short term, it’s important to recognize that gold prices are already trading near historic highs, and the potential for a pullback cannot be ignored. Both the RSI and CCI indicators are in elevated territory, approaching overbought levels, suggesting that a short-term technical correction may be on the horizon. If trade tensions begin to ease or if Federal Reserve officials deliver more hawkish commentary, gold prices could retreat.
From a medium- to long-term perspective, if U.S. inflation data continues to improve and the Fed delays rate cuts, a stabilization or rebound in the U.S. dollar could put downward pressure on gold. Additionally, major central banks around the world still hold significant gold reserves, and any large-scale profit-taking could trigger a decline in gold prices. In such a scenario, gold could correct down to the $3,100–$3,000 support zone, or even test the lower boundary of the ascending channel around $2,950.
That said, even if a correction occurs, the likelihood of a sharp drop remains limited due to ongoing global economic uncertainties and geopolitical risks. The market will continue to closely monitor Fed policy signals, inflation data, and developments in trade negotiations as key indicators for gold’s future direction. Moreover, with spot gold trading on a T+0 basis, traders can profit regardless of whether prices rise or fall, adding flexibility to short-term strategies.

Spot Gold

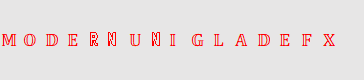
VIX Index
The VIX Index, often referred to as the "Fear Index," stands for the Chicago Board Options Exchange Volatility Index. It is a key measure of investor sentiment and market anxiety. Typically, it has a positive correlation with gold prices.
When the VIX rises, it indicates growing investor unease and heightened risk aversion, which tends to boost demand for safe-haven assets like gold—supporting a bullish outlook for gold prices. Conversely, when the VIX declines, it reflects improved risk appetite among investors and easing market fears, which can be a bearish signal for gold’s future performance.

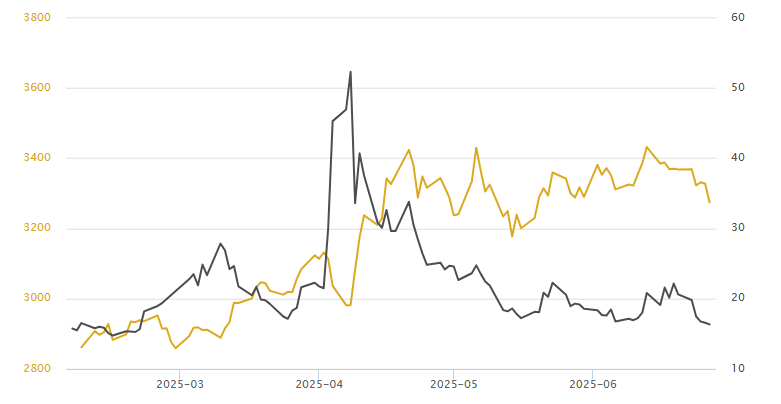
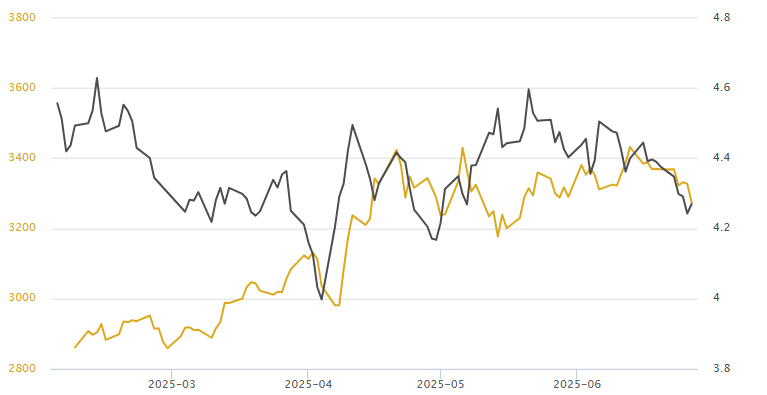
Spot Gold

US Dollar Index
Generally speaking, the U.S. Dollar Index and gold prices tend to show a negative correlation about 70% of the time. This means that, in most cases, when the dollar rises, gold tends to fall—and when the dollar falls, gold tends to rise.

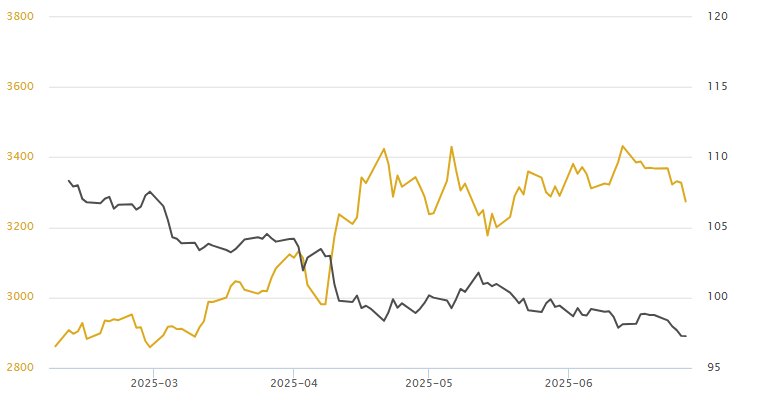
Spot Gold

10-year U.S. Treasury yield
The 10-year U.S. Treasury yield refers to the return on the U.S. government's 10-year bonds. Generally, it has an inverse relationship with gold prices—when the 10-year Treasury yield rises, gold tends to fall; when the yield declines, gold tends to rise.
The Gold Bug Index (HUI) is a leading indicator for predicting the direction of gold prices. This index includes 16 of the most important large gold mining companies in the U.S., such as Newmont Mining. Therefore, the rise and fall of the HUI reflect the market sentiment and outlook on gold prices held by major institutional investors and professional mining companies. Generally, the direction of gold prices moves in tandem with the HUI, and the index’s trend changes tend to slightly lead the movements in gold prices.
TIPS, or Treasury Inflation-Protected Securities, are inflation-linked bonds issued by the U.S. Department of the Treasury. Generally speaking, rising inflation is bullish for gold prices, while falling inflation is bearish. Therefore, the prices of TIPS often show a positive correlation with gold prices.
The CRB Index, also known as the Commodity Research Bureau Index, is a global commodity index. Since gold is a unique commodity, the CRB Index generally moves in the same direction as gold prices—that is, the CRB and gold prices tend to rise and fall together.
Annual Gold Price Key Events Timeline